The state of open infrastructure grant funding
Introduction
At IOI, our work to increase investment in open infrastructure (OI) relies on a deep understanding of how infrastructure is funded and by whom. Since 2020, we've studied, analysed, and published our findings about the funding landscape for OI for research and scholarship. We recognize that grant funding is just one revenue stream that supports open infrastructure, but as our research has shown, financial contributions (which include grants) are the primary source of revenue for many OIs.[1] Here, we take our deepest dive yet into the available data in order to better understand the amount, impact, and limitations of grant funding to OIs. To the limited extent possible, we also try to position this analysis within an overall picture of the financial operations of open infrastructures.
The dataset we have assembled includes 514 awards made by 23 distinct funders to 36 open infrastructures (OIs), totaling US$415,845,753, and dating back to 2000. Of these awards, we estimate 149 of them (totaling $174,491,754) represent direct support to OIs, and the remainder support activities which depend on that infrastructure in some measure. This work greatly expands IOI’s 2022 analysis of 137 funder-reported grant awards (for a total of $124,972,660) made to 28 key infrastructures and data from 22 funding organizations (Dunks, 2022) including ten members of the Open Research Funders Group. In updating our original dataset, we elected to keep the focus squarely on funder-reported grants, but we also tried to identify what the funding actually supported — e.g., did it provide direct support to the infrastructure itself, or did it support work that used an OI, potentially without actual connection to the OI in question.
These are not trivial sums, particularly given the limitations of the current dataset. We scoped our data collection efforts to focus on the OIs included in IOI’s Infra Finder[2], which are related to repository infrastructure. As such, they tilt strongly towards tools and services in current use by libraries, and were selected based on Infra Finder’s criteria for inclusion. We were also limited by the availability of data that we could harvest and add to our dataset using our current methods. Even with these limitations, we think these numbers reflect something of the importance of the sector, and demonstrate the great potential a larger and more complete and varied dataset would have for understanding and informing investment decisions. We look forward to continuing to build out and make use of such a resource.
Methods
Data collection
We focused on funder-reported and centrally reported data as the sources of record. We compiled a list of funders of interest from IOI’s earlier exploration of funding for open infrastructures (Dunks, 2022) and funding sources reported by the 57 infrastructures listed in IOI’s initial launch of Infra Finder. We chose to focus on open infrastructures (OIs) in Infra Finder in order to be able to tie our analysis back to additional attributes of those OIs that are included in the tool, and potentially leverage the data available there.
We employed multiple methods for collecting award data associated with 20 funders, which we describe more fully in the accompanying dataset (Riordan et al., 2024). Briefly, we harvested available award data directly from the websites of 12 funders. [3]
We also obtained data from OpenAIRE, collating it from the OpenAIRE Research Graph data dump of 16 January 2024 (Manghi et al., 2024) into the COKI Academic Observatory system (Hosking et al., 2023) on 13 February 2024. Data on National Science Foundation (USA, NSF) grant awards was collected from the NSF website[4] as XML files for the years 2010–2024. Data for all funders was manually uploaded to BigQuery.
Finally, we reviewed the funder-reported data in IOI’s earlier dataset (Dunks, 2022) for awards that we did not capture with our current methods.[5] We added missing information if we could find it (most often title, description, and funder’s award ID). If we could not verify that an award was to an OI on our list, we did not include it in our updated dataset.
Selecting and deduplicating awards
We used a predefined list of search terms to search the description, title, and recipient of each award, and interpreted a match in any of these fields to indicate that an award was of plausible interest. We then manually reviewed award titles and descriptions to determine whether they were relevant and excluded those which had no clear relationship to any of the OIs of interest. Duplicate awards were also excluded from the final dataset.
Data manipulation and enhancement
Currency conversions
For awards made in currencies other than US dollars (USD), we used the European Central Bank’s currency converter[6] to convert the amount to USD, using the start date of the grant or 1 January of the award year if a specific date is not available. If no date information is available at all, no conversion is made and the award does not factor into any analysis of award amounts, but is included in award counts. Award amounts in the original IOI dataset were converted to USD using the 2010–2020 average exchange rates reported in Exchange Rates UK.[7]
Award categories
We assigned each award to a category based on its title and description (see Appendix for complete list and definitions for each category). We also group the awards into several categories to differentiate between those that constitute direct support to an OI, and those that do not, but that demonstrate the impact these infrastructures have on research and scholarship.
These assignments are somewhat subjective. For example, it may not be completely clear from an award description whether a named an existing repository infrastructure is enabling a new project, in which case the award might be categorized as “Adjacent”, or whether a completely new instance of the repository infrastructure is being created, in which case the appropriate category would be “Adoption”. Similarly, we attempt to distinguish between new feature development and routine code maintenance and updating (“Research and development” for the former, and “Operations” for the latter), but this is not always completely clear.
Data and data dashboards
A copy of the file we used as the basis for the analysis presented here is available for download on Zenodo (Riordan et al., 2024). We also used Looker Studio to create dashboards to allow for a more dynamic exploration of the underlying data. At the time of publication, the data driving the dashboard was identical to what we used for analysis, and readers are invited to explore it. [8] We hope to update and extend this dataset over time.
Caveats and assumptions
Please see the full dataset documentation for additional information on how we processed the data, as well as assumptions we made and their likely trade offs.
Results and discussion
Observations about the dataset
We acknowledge again up front that the scope of the data we collected is limited by our choices of OIs and of funders, and also by the lack of availability of data for some of the funders we were interested in (or the limitations of our methods for accessing it). We think this is offset to some degree by having the ability to do a deeper and more nuanced analysis of how funding is distributed, on the basis of additional information and attributes of OIs that we’ve collected in Infra Finder.
General characteristics of OI funding
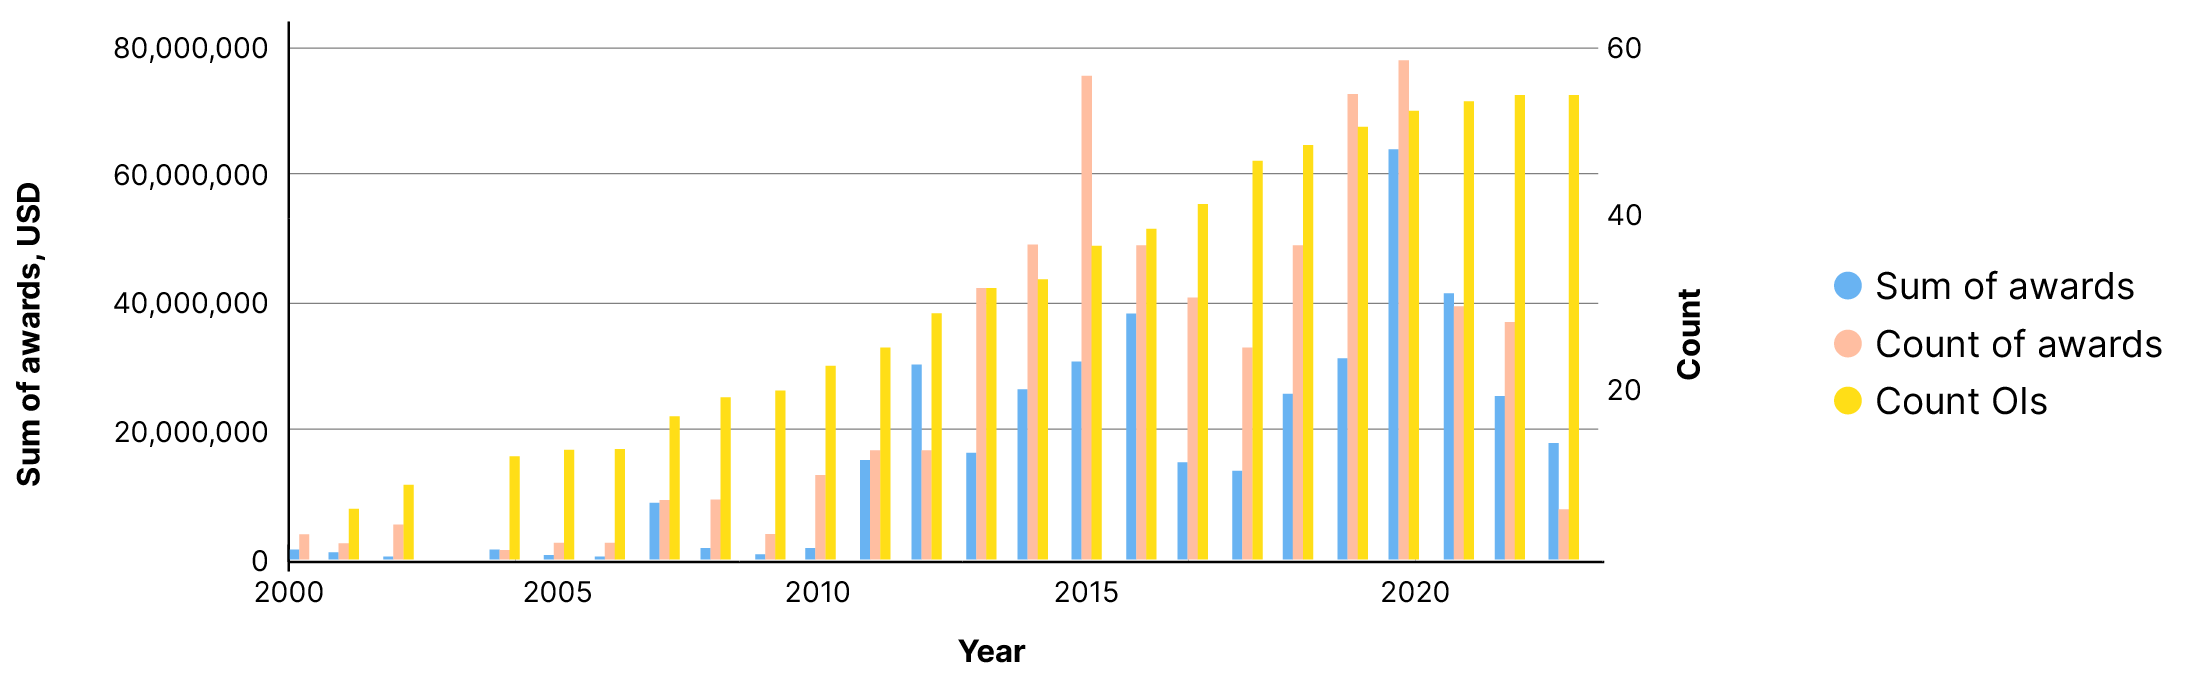
The grant awards in our dataset provided a total of US$415,845,753 from 23 funders to 36 OIs, via 514 awards made over the time period 2000–2024 (Table 1). Award amounts ranged from $442 to $15,000,000 and the mean and median award amounts were $833,358 and $279,636, respectively. Many of the OIs in the dataset were launched over this time period, and we see an increase in overall funding and number of awards made as well (Figure 1). Because it is difficult to disentangle the overall growth in the number of OIs over time from trends in funding, we did not analyse the data for temporal trends.
| All awards | Direct support | Indirect support | Adoption Support | |
|---|---|---|---|---|
| Total funding (USD) | $415,845,753 | $174,491,754 | $218,290,115 | $10,807,041 |
| Award count | 514 | 149 | 284 | 40 |
| Funder count | 23 | 20 | 14 | 8 |
| Ol count | 36 | 30 | 26 | 9 |
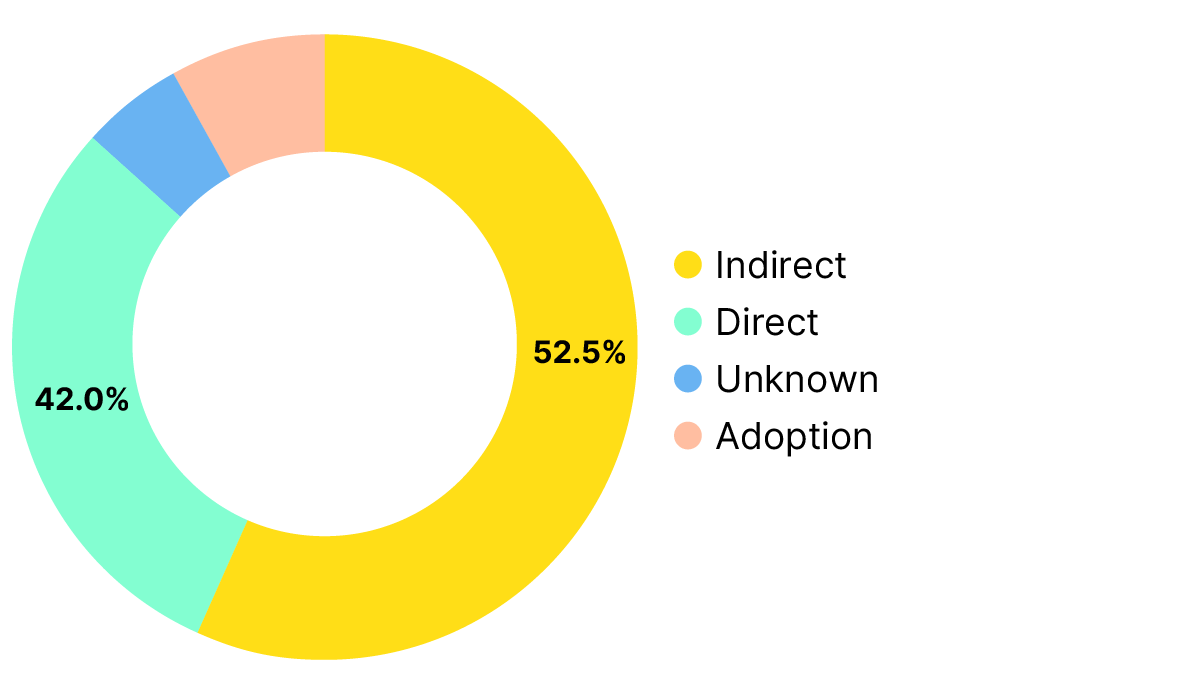
We categorized awards to reflect whether they provide direct support to an OI, indirect support (meaning the OI is referenced in the award title or abstract, but the funding does not directly support the OI though it may provide some indication of on OI’s broader impact), adoption support (funding that supports the implementation of an instance of an OI at a local or community scale), and grants we were unable to classify (unknown). While a significant amount (42%) of funding goes to direct support, the majority of the funding (52%) goes to indirect support (Figure 2). We further analyse the direct, indirect, and adoption categories later in this report.
Direct funding to OIs
Top funders
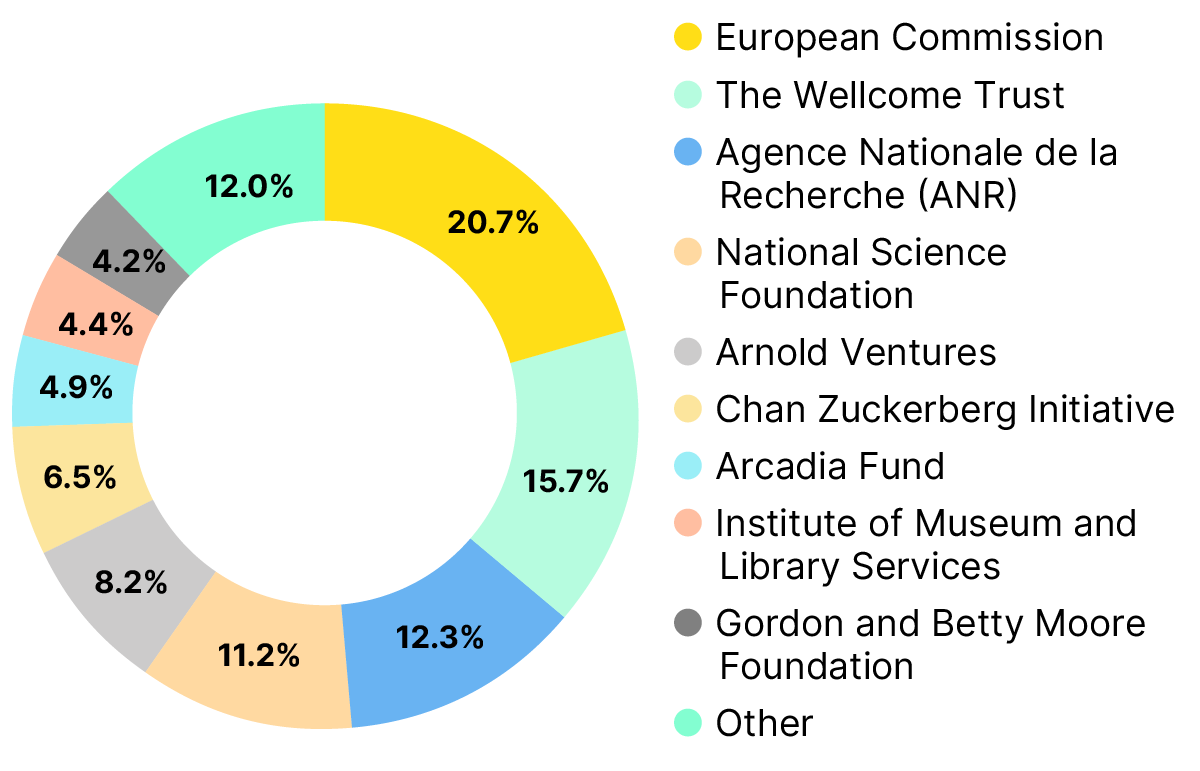
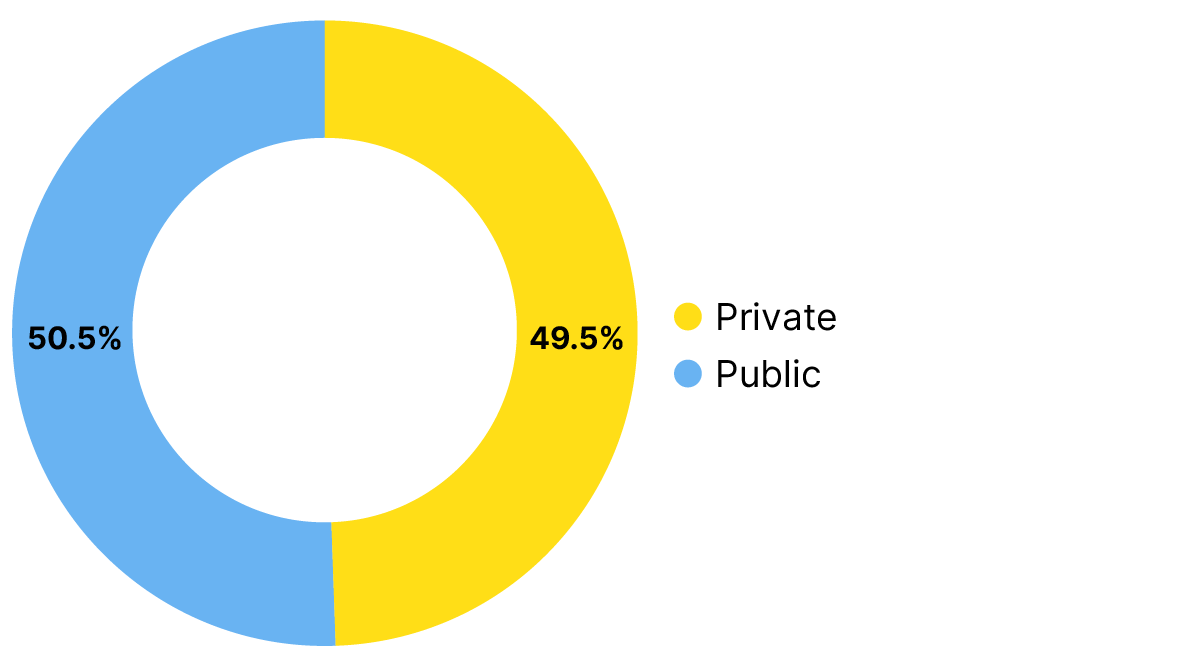
We wanted to tease out trends in direct and indirect support to OIs in order to better understand how much funding is made available to support OIs directly, as opposed to how much additional funding relies on the use of open infrastructure without necessarily supporting it directly. The European Commission (EC) tops the list by total amount of direct support to OIs (Table 2, Figures 3). The EC’s open infrastructure portfolio consists primarily of three multi-million euro awards to DataCite and multiple awards to Europe PMC and OAPEN Library. We note that the EC’s awards to DataCite total nearly US$30M (one of which we found difficult to attribute with absolute certainty as direct support for DataCite, but that is how we chose to classify it) and may disproportionately affect the overall funding picture when we look at total award amounts. The Wellcome Trust is also a top funder and an important and ongoing supporter of Europe PMC, providing 11 awards totaling nearly $23M since 2013. Direct support to OIs is evenly distributed across public and private funding bodies (Figure 5).
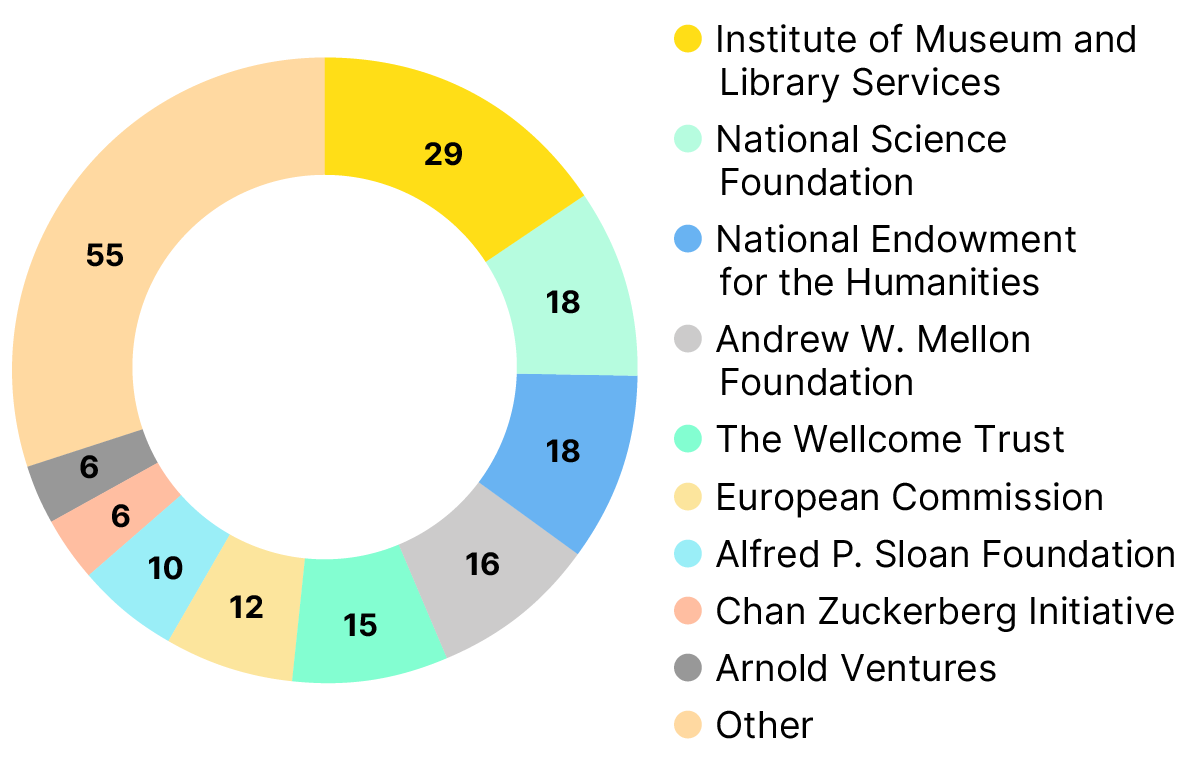
The Institute of Museum and Library Services (IMLS) issued the largest number of awards of any funder (29), with multiple awards to Omeka (9), Mukurtu (8) and Fedora (6), and additional awards to DSpace, Dryad, Hyku, Open Science Framework (OSF), and the Research Organization Registry (ROR) (Table 2, Figure 4).
| Funder | Award total (USD) | Award count |
|---|---|---|
| European Commission | $36,070,103 | 12 |
| The Wellcome Trust | $27,439,563 | 15 |
| Agence Nationale de la Recherche (ANR) | $21,415,748 | 2 |
| National Science Foundation | $19,583,613 | 18 |
| Arnold Ventures | $14,310,360 | 6 |
| Chan Zuckerberg Initiative | $11,280,875 | 6 |
| Arcadia Fund | $8,500,000 | 2 |
| Institute of Museum and Library Services | $7,631,406 | 29 |
| Gordon and Betty Moore Foundation | $7,362,795 | 4 |
| Other | $20,897,291 | 55 |
| Total | $174,491,754 | 149 |
Funding by award and infrastructure categories
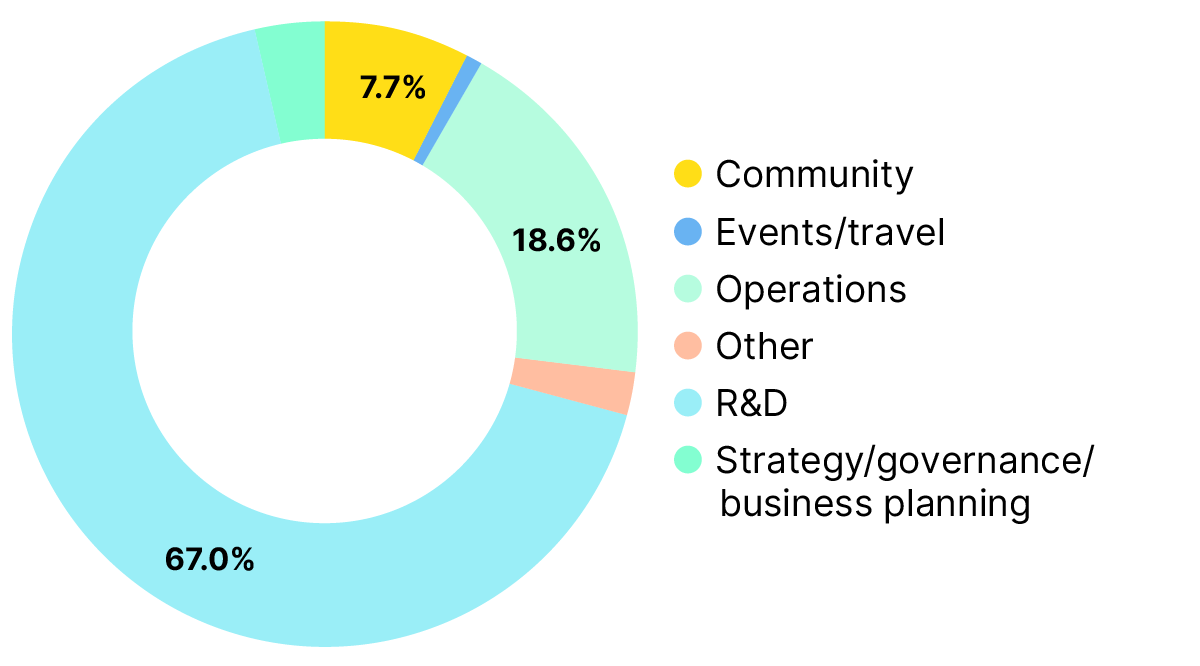
We categorized each award according to the definitions in the Appendix. Research and development (R&D) dominates the picture, whether we look at the award total (67%) or award counts (71%, not illustrated here), followed by operations (18.6% by total amount). Community building, events and training, strategy/governance/business planning, and awards classified as “other” all earned less than 10% of the funding total (Figure 6). These results support the claim that philanthropy tends to favour innovation over sustaining existing endeavours (e.g. Skinner, 2019), but support for the latter is not insubstantial.
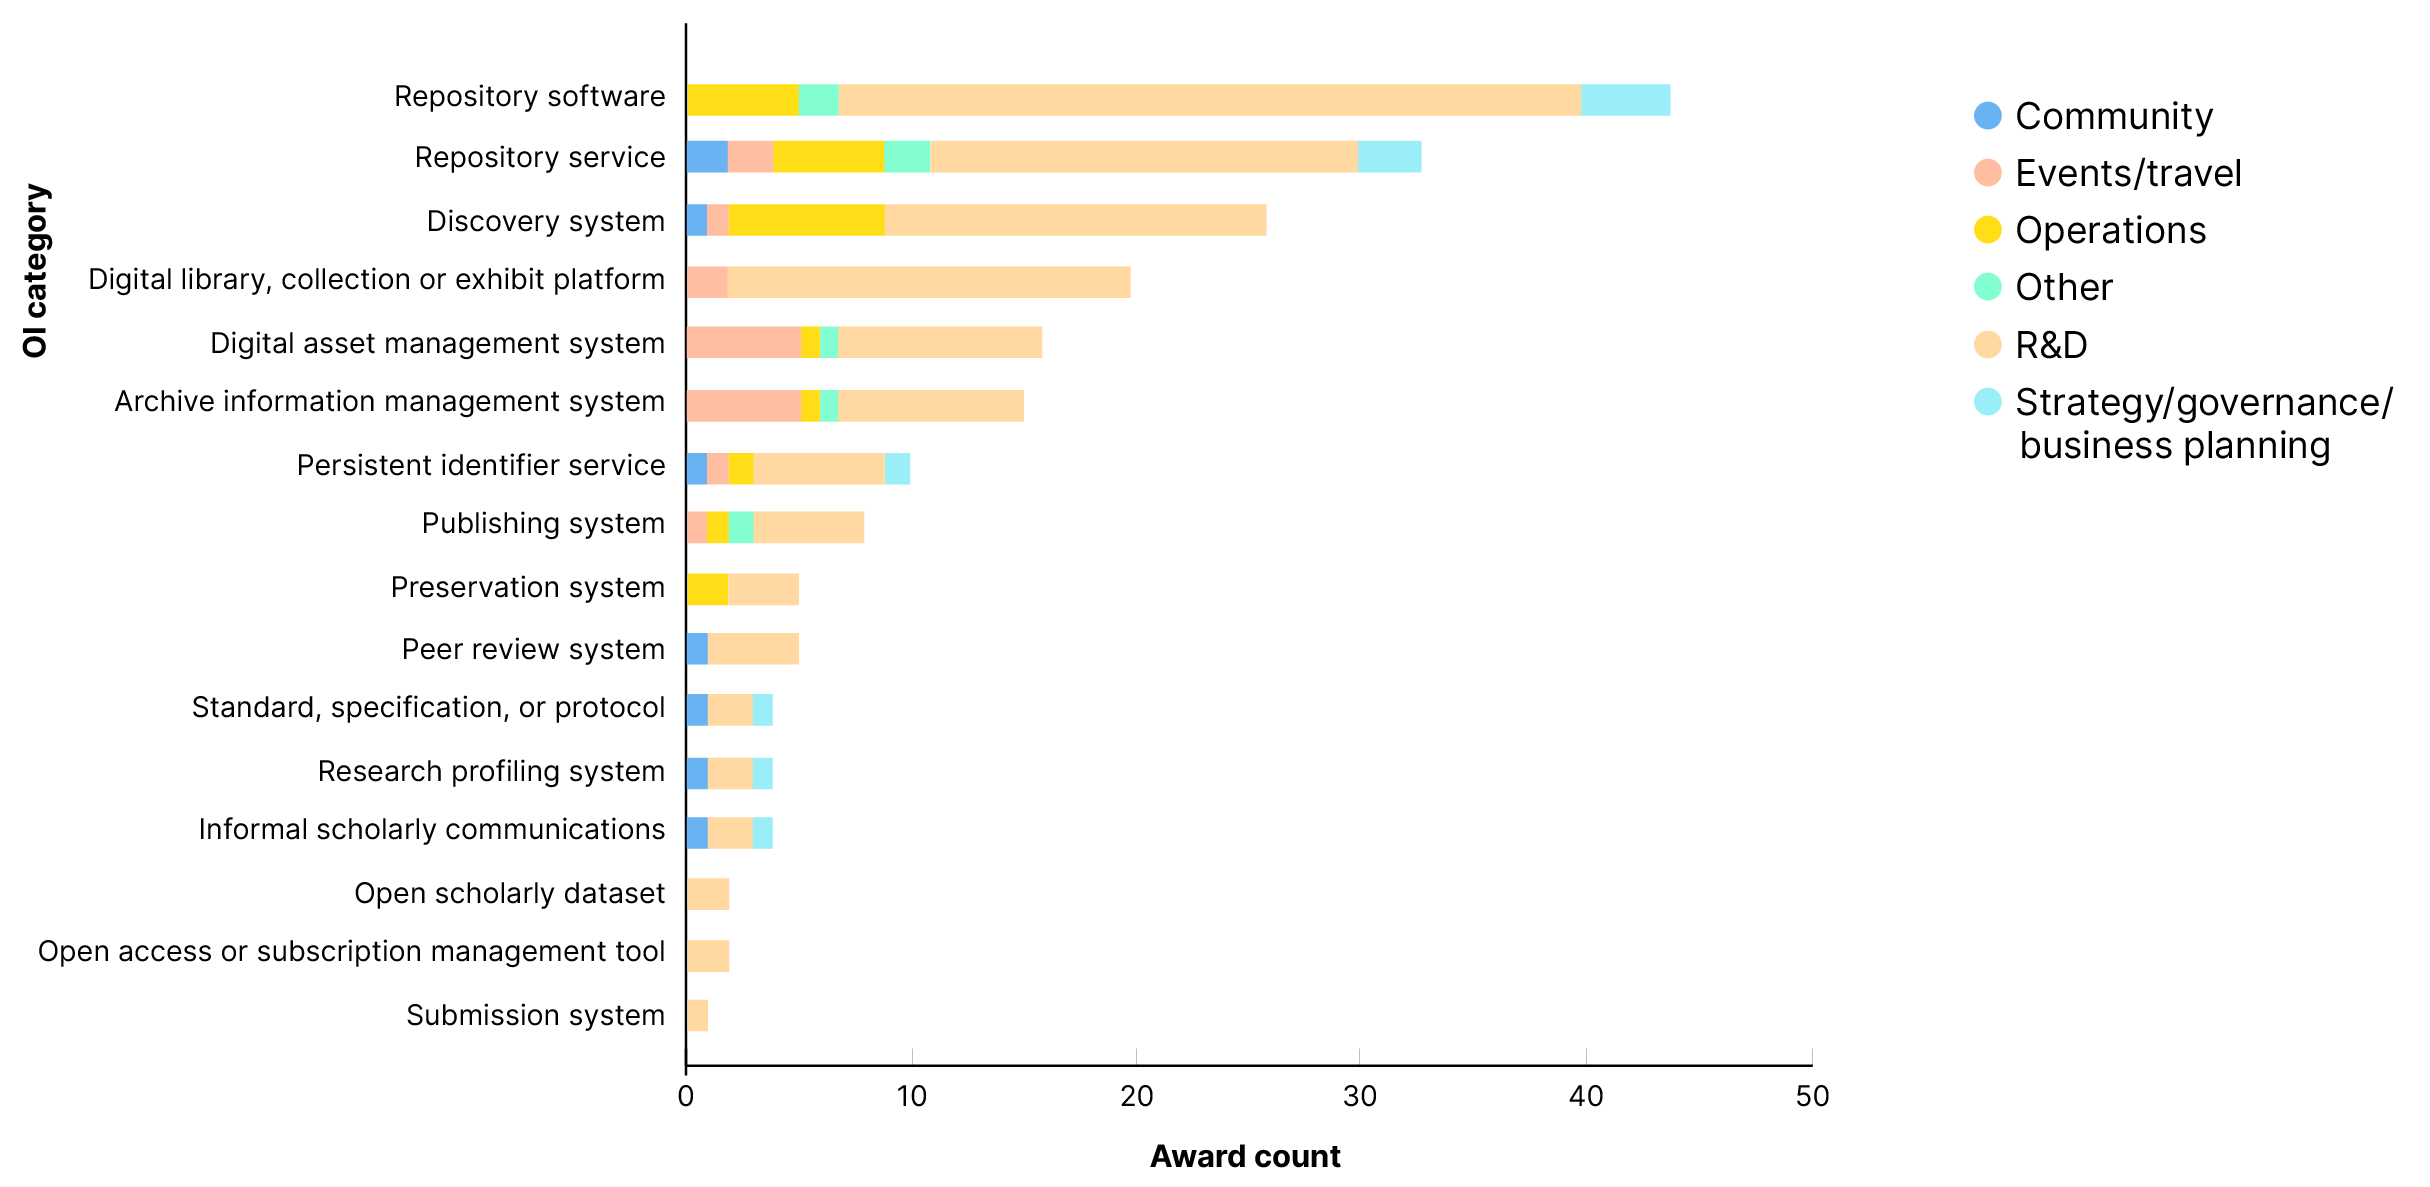
We also looked at the distribution of funding across OI category and grant category. Each OI is assigned to at least one (and usually just one) category, although six placed themselves in two categories, and two placed themselves in three categories. Because an OI may be assigned to more than one category, we consider here only the counts of awards rather than looking at totals, which would amplify the problem of counting some awards more than once. With that caveat, the constellation of open infrastructures that are digital content distribution and/or management platforms — repository software, repository service, digital library, collection, or exhibit platform, and digital asset management system — are the kinds of applications we focused our early data collection efforts on for Infra Finder. Unsurprisingly, these receive more awards than most other categories (Figure 7). Perhaps more interesting here is that the pattern of R&D as the main vehicle for investment holds across the full range of OI categories, and that there is little investment in strategy, governance, and business planning — important activities for ensuring the ongoing sustainability of OIs.
Top funding recipients
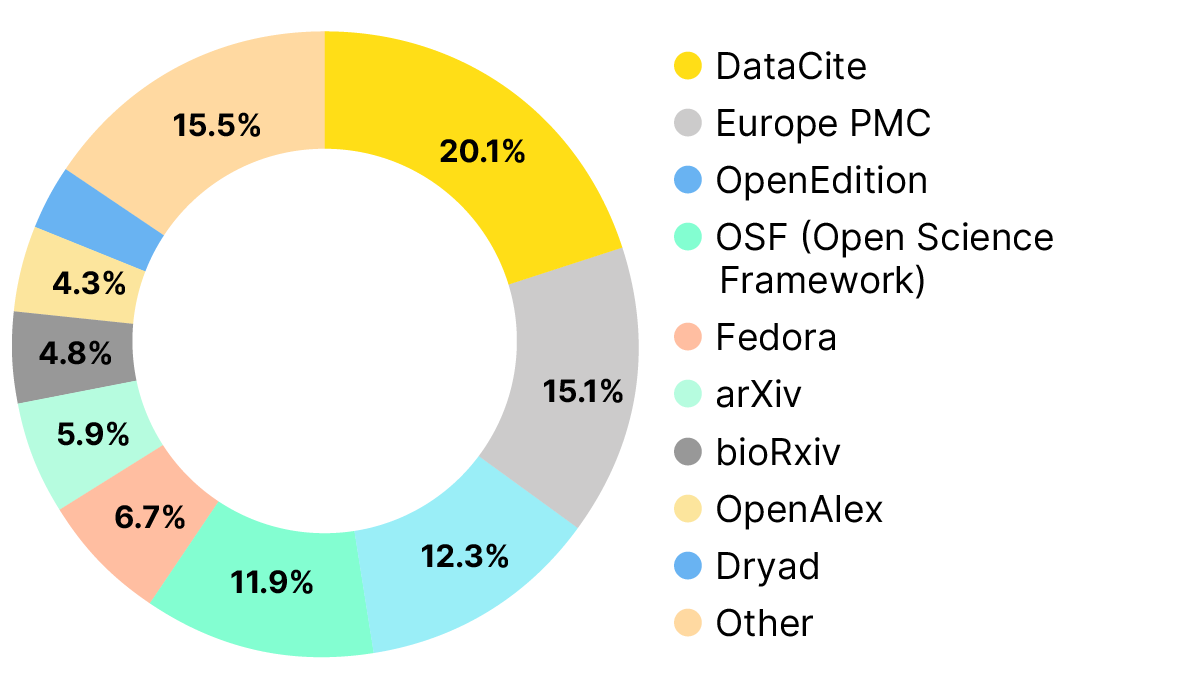
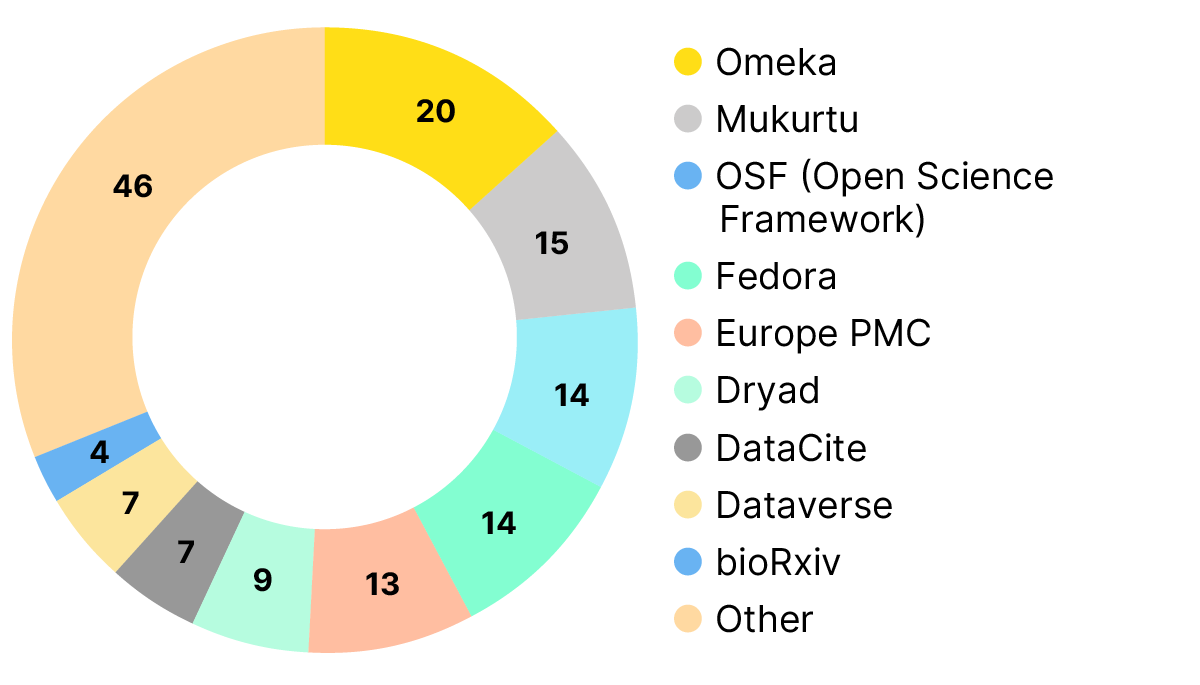
DataCite, Europe PMC, OpenEdition, OSF and Fedora are the top five funding recipients by award amount (Table 3, Figure 8). Again, this is likely skewed a bit by a few very large awards to DataCite. Looking at award counts, Omeka, Mukurtu, OSF, Fedora, and Europe PMC are the top recipients. IMLS, National Endowment for the Humanities (NEH), and to a lesser extent the Mellon Foundation have made sustained investments in the Omeka (20 awards) and Mukurtu (15 awards) platforms (Figure 9), and as we will see later, IMLS and NEH have also made numerous awards to support the adoption of these same platforms.
| OI | Award total (USD) | Award count |
|---|---|---|
| DataCite | $35,143,158 | 7 |
| Europe PMC | $26,431,542 | 13 |
| OpenEdition | $21,415,748 | 2 |
| OSF (Open Science Framework) | $20,794,818 | 14 |
| Fedora | $11,715,877 | 14 |
| arXiv | $10,378,304 | 3 |
| bioRxiv | $8,382,354 | 4 |
| OpenAlex | $7,500,000 | 1 |
| Dryad | $5,734,388 | 9 |
| Other | $26,995,565 | 82 |
| Total | $174,491,754 | 149 |
Indirect funding to OIs
It was not our original intention to explore indirect funding for OIs, but in the process of identifying relevant awards, we noticed that a large number of awards reference the use of open infrastructure without apparent direct support for it. These are largely references to depositing preprints, other publications or datasets into repositories (categorized as “use”), but there are also references to more substantive uses, which we categorized as “adjacent”. Examples of uses that we categorized as “adjacent” include building new infrastructure that leverages existing OI, expanding or adding to digital collections that already utilize OI for access, or the development of additional features or customizations for local use (i.e. new development that is not contributed back to a community code base). Categorizing awards that fall along a continuum of uses into the two distinct categories we used was not always obvious or straightforward. Nevertheless, we posit that these uses, along with awards that support adoption of an OI, have the potential to provide a useful indication of an infrastructure’s impact.
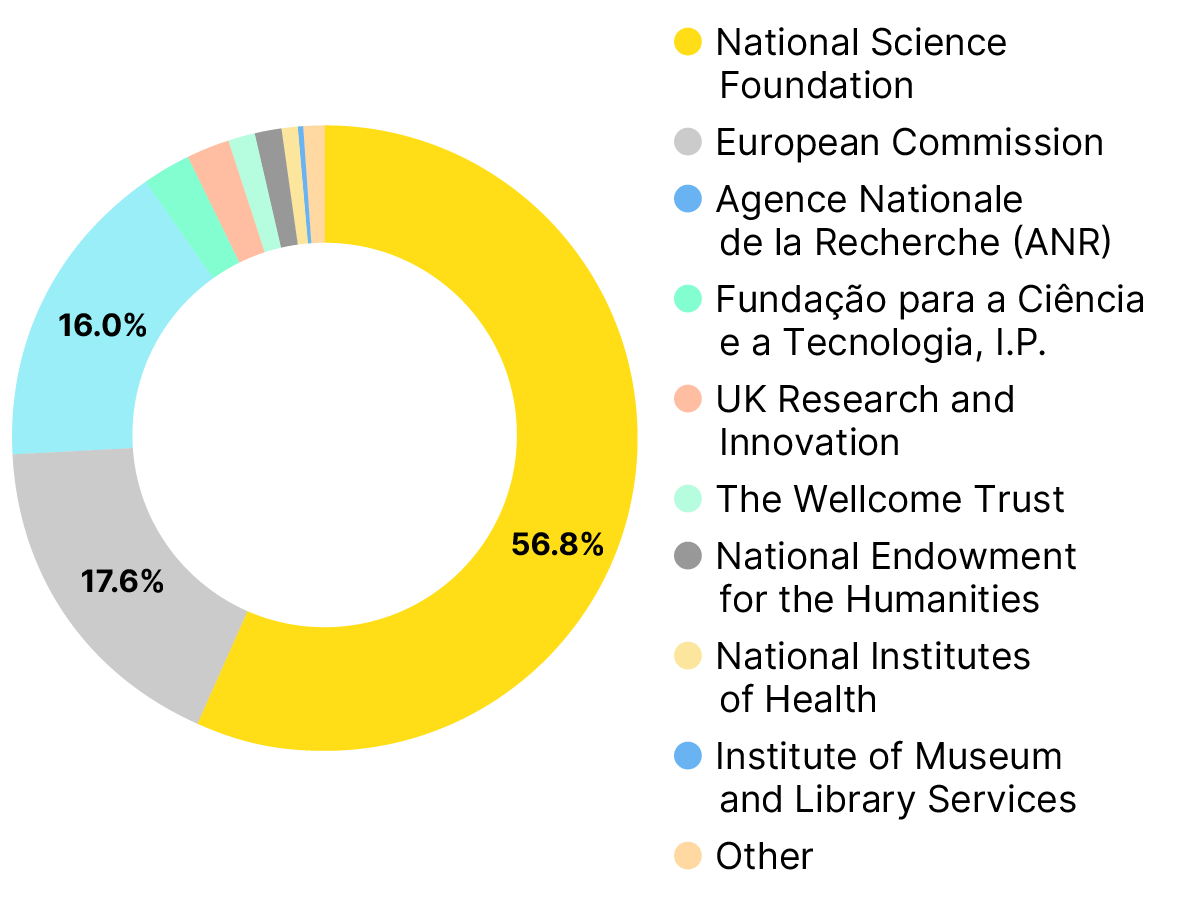
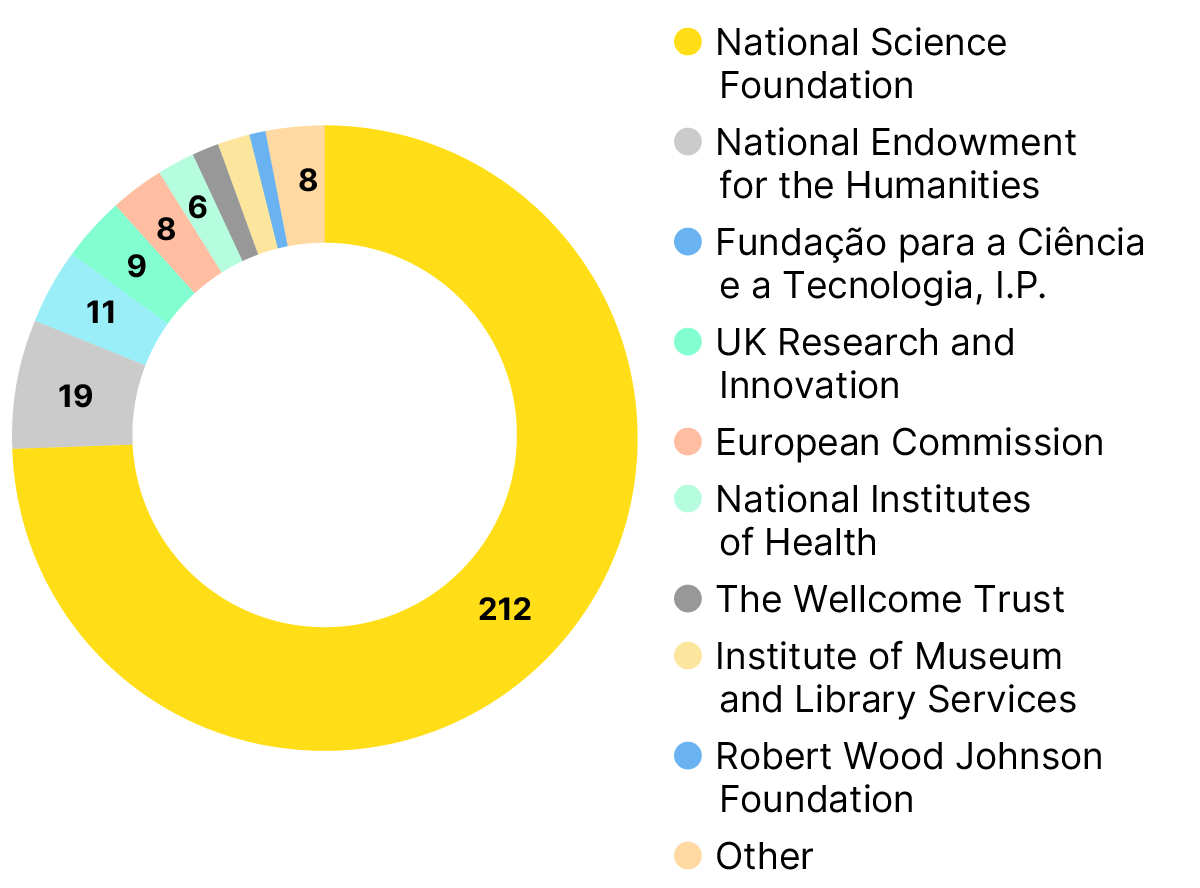
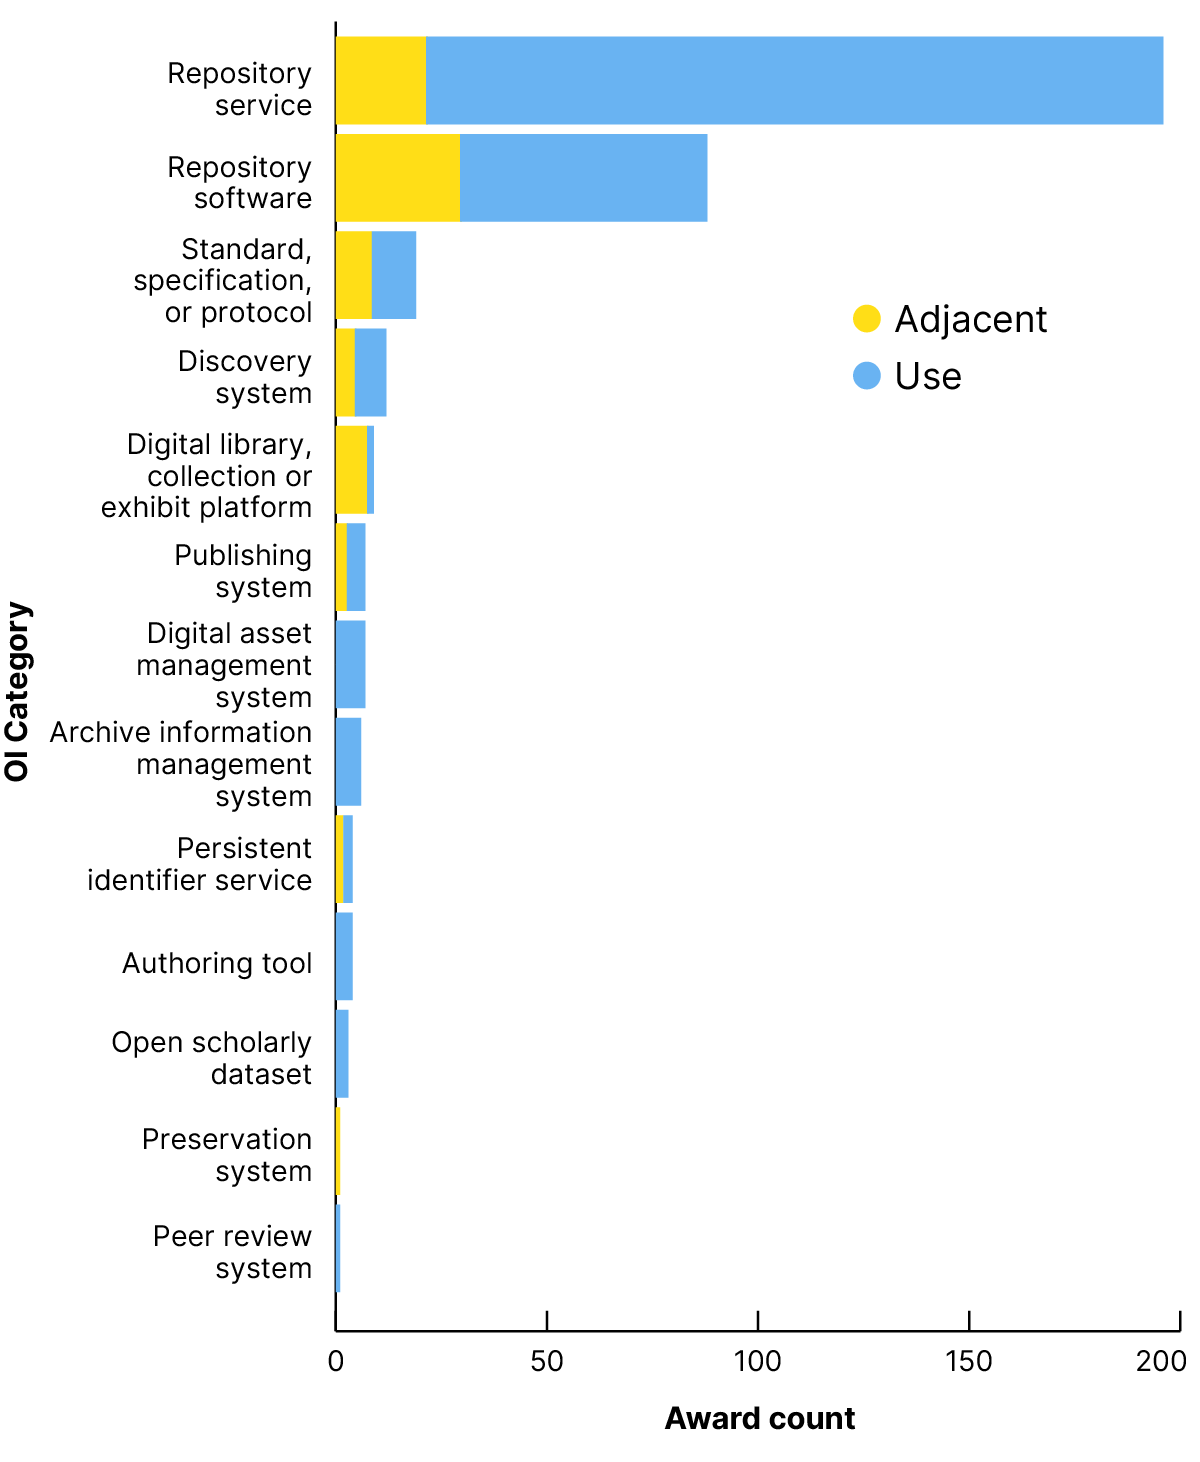
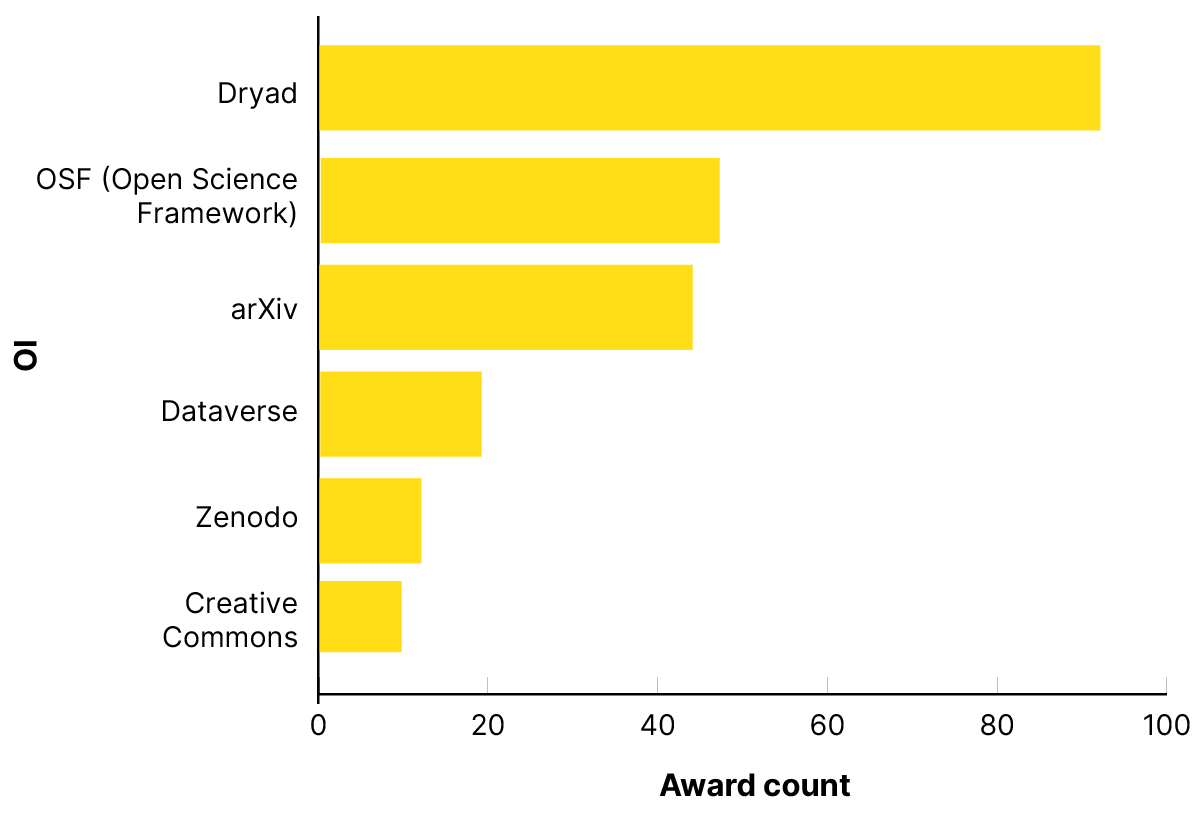
We found that US NSF awards make up the majority of indirect support awards, by total amount and count (Table 4, Figures 10–11). With the European Commission and the Agence Nationale de la Recherche (ANR) as the second and third most significant funders respectively (by amount), it is public funders that are the source of most of the indirect support awards (Figures 10–11). The majority of indirect support awards fall into the “use” category, and the majority of uses are related to the use of (deposit to) repository services, followed by use of repository software (Figure 12). The most used repository services are Dryad, OSF, and arXiv (Figure 13).
That open infrastructure should be such an important catalyst for the research enterprise is both exciting and a potential cause for concern. Recall that we identified relevant awards on the basis of the appearance of the name of OIs of interest in the award title, description, or recipient. We don’t think it is unreasonable to suggest that mentioning a repository a researcher intends to use in one of those fields is significantly less common than it is in an award’s project description or data management and sharing plan, hence our estimate of indirect support is surely a significant underaccounting of this phenomenon. Where these uses place direct demands on infrastructure, in the cases where usage or other direct fees that scale with use are not charged, these uses may place OIs under increasing strain and potentially threaten their sustainability (Steinhart & Skinner, 2024).
| Funder | Sum of awards (USD) | Award count |
|---|---|---|
| National Science Foundation | $124,080,506 | 212 |
| European Commission | $38,389,231 | 8 |
| Agence Nationale de la Recherche (ANR) | $34,950,628 | 3 |
| Fundação para a Ciência e a Tecnologia, I.P. | $5,518,159 | 11 |
| UK Research and Innovation | $4,778,703 | 9 |
| The Wellcome Trust | $3,177,695 | 4 |
| National Endowment for the Humanities | $3,082,906 | 19 |
| National Institutes of Health | $1,422,178 | 6 |
| Institute of Museum and Library Services | $1,033,745 | 4 |
| Other | $1,856,364 | 8 |
| Total | $218,290,115 | 284 |
Support for OI adoption
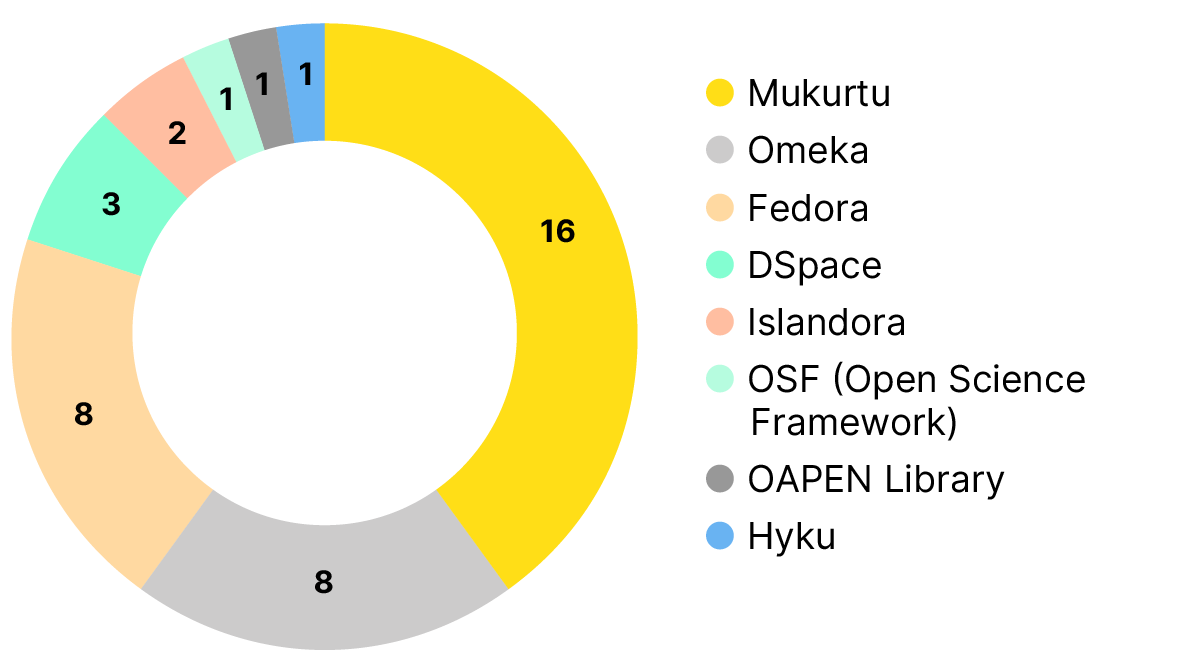
We also encountered a number of grant awards that support adoption of a particular OI to support a larger project, without an indication of funding being directed towards the OI itself. A significant amount of this funding is provided by IMLS and NEH to support the use of Omeka (8 awards) and Mukurtu (for indigenous communities, 16 awards) to build and deliver digital collections. Fedora is also named in eight awards from five different funders (Figure 14). All of these infrastructures are repository software. As with the indirect support awards we describe above, we think these awards may serve as a meaningful signal of uptake and impact that an OI has. And as with other kinds of indirect support, the possibility exists that these uses may impose an additional uncompensated burden on the underlying infrastructure, or alternatively, benefit it, as new adopters may choose to also support that infrastructure directly. Of course adoption is the point for open infrastructure — but it is worth examining the interplay between adoption and use, financial support, and demand on an infrastructure community’s resources.
The role of grant awards in the overall financial status of open infrastructure
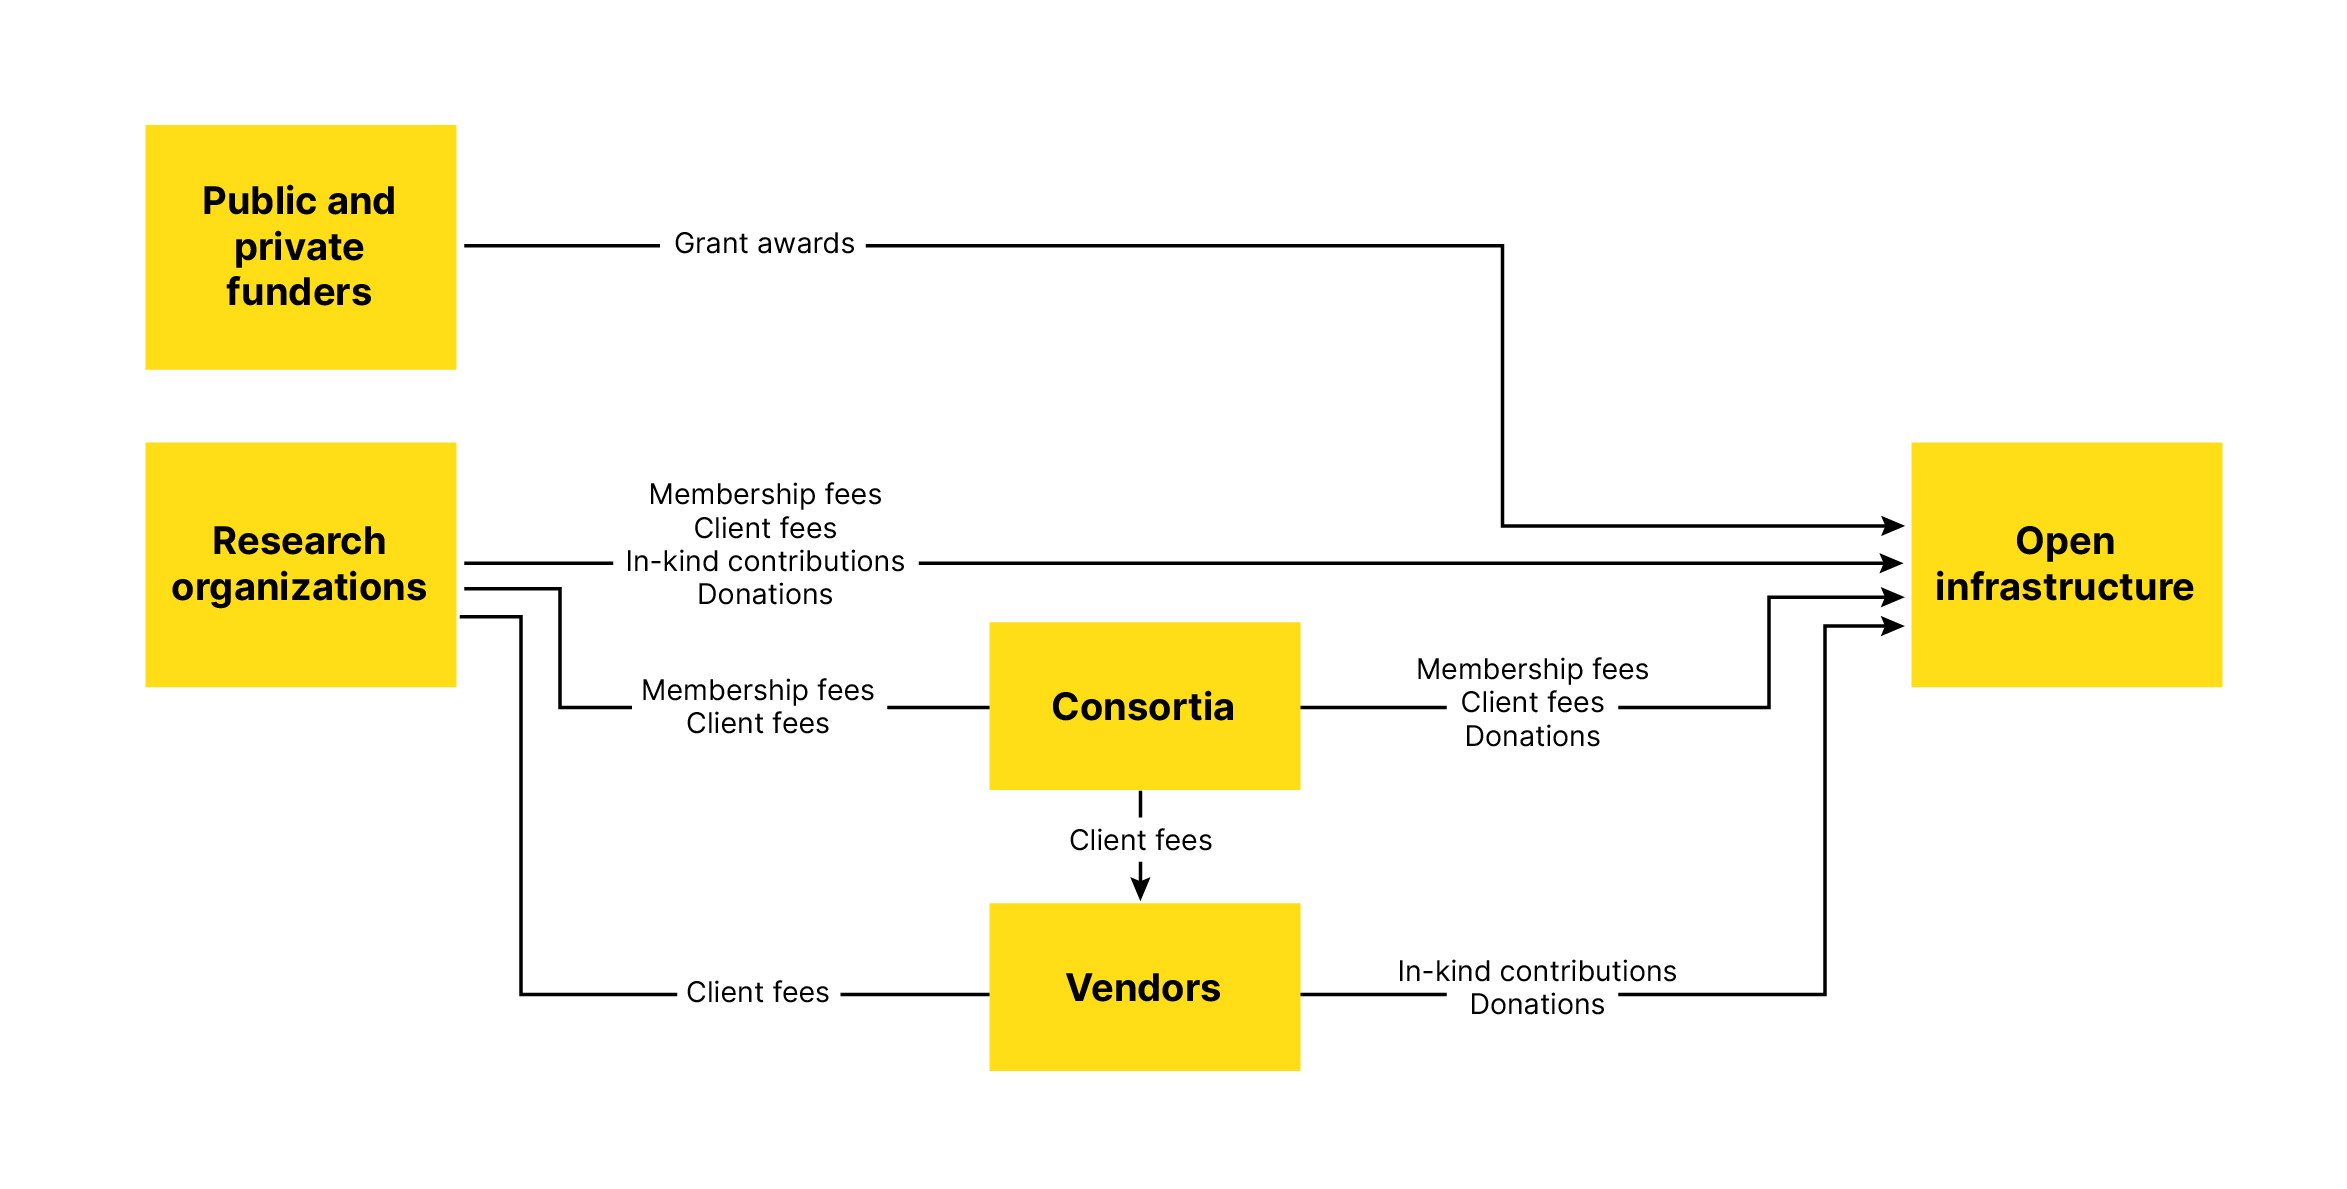
Grant awards represent just one of many potential sources of revenue (Figure 15). Other sources of revenue include membership fees and donations (paid directly by individual organizations, or by supporting consortia), client fees (again from organizations or consortia, in circumstances where the OI might provide a vended option that they support for a fee), in-kind contributions from organizations that contribute to the development of an OI or provide some other non-monetary form of support, and donations and in-kind contributions from vendors whose business utilizes an OI.
We would very much have liked to put this analysis of grant award data into this larger context, bringing in publicly available financial information for as many OIs as possible. We started to attempt this, and quickly encountered a couple of significant issues. First, financial reporting requirements vary by jurisdiction, and information is not universally or freely available. The most readily and freely available source of this data are the IRS 990 forms filed by non-profit organizations in the US, which we were able to obtain for four OIs that are independent nonprofits. Required reports are available for OIs incorporated in other countries, but for a fee in the case of the jurisdiction we were most interested in (Netherlands, for three OIs). Second, the placement of an OI within its host organization varies, and reported financial information may or may not be particularly meaningful at the level of the individual OI. At one extreme, an organization’s entire raison d'être may be to manage and sustain an OI. In this case, the organization’s financial information gives us meaningful insight into the OI’s overall financial picture. At the other extreme, an OI may be embedded in a very large organization, with financials that are inextricably intertwined with those of the host (for example, an OI that is hosted by a large university), and the financial performance of the host tells us little or nothing about the financial status of the OI itself. Somewhere in the middle are independent organizations that sustain more than one OI (Code for Science & Society, IOI’s host as well as the host of the International Interactive Computing Collaboration (2i2c), PREreview, and others). Annual reports are another potential source and often contain some self-reported financial information, potentially at the level of an individual OI. This information is not reported in any standardized way, but at least it generally reflects more closely the operations of the OI than its host organization, and we were able to locate annual reports for an additional 13 infrastructures. The best we can say from these varied and limited sources of information (and taking annual reports at face value) for 12 of the OIs that report total revenue and expenses, whether in a formal statement such as a 990 or self reported in an annual report, is that none report operating at a loss (total revenue less total expenses was always greater than or equal to zero), and that organizations who indicated to us that their primary source of revenue is contributions did so accurately where we were able to verify this independently.
Nearly half of the OIs we canvassed as part of our data collection effort for Infra Finder reported contributions (which include grant awards) as their primary source of funding, and contributions were the single most important source of funding for OIs that operate as independent or fiscally-hosted nonprofits. We also know from that same population of OIs that 21 of the 44 who provided statements of their funding needs mention developing or maintaining basic service functionality as an explicit need (we counted these mentions as a need for operations support).[9] This is not news (see Skinner, 2019, for example), but is evidence of a potential misalignment between funding OIs are able to bring in (grant awards for innovation) with the operational needs they are striving to meet.
Conclusions
We have assembled the beginnings of a potentially useful resource for understanding the funding landscape for open infrastructure, and intend to continue to expand and update it. Our key findings in this phase of work are:
- Even in a bounded analysis such as this, the amount of funding that flows not only directly to open infrastructure, but also to users of open infrastructure, is substantial. This indirect support may represent both a useful measure of the impact of open infrastructure on the research ecosystem, as well as the potential strain upon it.
- Funders continue to favour making awards for innovation rather than ongoing support, with some important exceptions.
- Grant awards play an important role in the overall finances of open infrastructures where we are able to make that assessment, but consistent data at the appropriate level of granularity is hard to come by.
Data availability
The grant awards data used for the analysis presented here (Riordan et al 2024) is available online: https://doi.org/10.5281/zenodo.10934085.
Interactive dashboards allowing direct exploration of the data are available at https://lookerstudio.google.com/s/oStqguBdU7E.
References
Collister, L., Tsang, E., & Wu, C. (2024). Infra Finder: A new tool to enhance transparency, discoverability, and trust in open infrastructure. International Digital Curation Conference (IDCC), Edinburgh, Scotland. (Preprint) https://doi.org/10.5281/zenodo.10913249
Dunks, R. (2022). Reported funding data for open infrastructure. https://doi.org/10.5281/zenodo.7259472
Hosking, R., Diprose, J. P., Roelofs, A., Chien, T.-Y., Massen-Hane, A., Smith, K. R., Handcock, R. N., Kramer, B., Napier, K. R., Tonti-Filippini, J., Montgomery, L., & Neylon, C. (2023). Academic Observatory Workflows. Zenodo. https://doi.org/10.5281/zenodo.10278531
Manghi, P., Atzori, C., Bardi, A., Baglioni, M., Schirrwagen, J., Dimitropoulos, H., La Bruzzo, S., Foufoulas, I., Mannocci, A., Horst, M., Czerniak, A., Iatropoulou, K., Kokogiannaki, A., De Bonis, M., Artini, M., Lempesis, A., Ioannidis, A., Manola, N., Principe, P., … Pierrakos, D. (2022). OpenAIRE Graph Dump (7.0.0) [Data set]. Zenodo. https://doi.org/10.5281/zenodo.10488385
Riordan, D., Huang, C.-K., Neylon, C., & Steinhart, G. (2024). Data for: The State of Open Infrastructure Grant Funding, 2024 State of Open Infrastructure Report [Data set]. Zenodo. https://doi.org/10.5281/zenodo.10934085
Skinner, K. (2019). Why Are So Many Scholarly Communication Infrastructure Providers Running a Red Queen’s Race? | Educopia Institute. https://educopia.org/red-queens-race/
Steinhart, G., & Skinner, K. (2024). The Cost and Price of Public Access to Research Data: A Synthesis. https://doi.org/10.5281/zenodo.10729575
Appendix. Award category definitions
Award categories and the codes used in the awards data, and their definitions. We further recognize three super categories of grants: those that provide direct support to an OI, those that support adoption of an OI, and those that do not provide direct support but reflect other uses that demonstrate the broad impact of an OI.
| Category (code) | Definition | Super category |
|---|---|---|
| Adjacent (ADJ) | Award is not directly to the OI but supports activities adjacent to it in some way. Examples:
|
Indirect |
| Adoption Community(ADOPT_C) | Award supports adoption, upgrades to existing instances, or similar direct adoption support broadly in a community. | Adoption |
| Adoption - local (ADOPT_L) | Award supports adoption in a single institution or local context. | Adoption |
| Community (COMM) | Award supports community building initiatives. | Adoption |
| Events/travel (EV_TR) | Award supports events and/or travel. | Direct |
| Operations (OPS) | Award supports basic operations, including code maintenance and updates that would not normally be considered new development. | Direct |
| Other (OTHER) | Direct support for other activities not defined here, or multiple activities with an unclear primary activity. | Direct |
| Research and development (RD) | Award supports research and development, including software development. Research and development work may be performed by organizations other than the OI's host or home organization. | Direct |
| Strategy/governance/business planning (STRAT) | Award supports strategic, governance, or business planning. | Direct |
| Use (USE) | Award references intention to use an existing OI for dissemination of content (e.g. deposit to a repository or preprint service), or other direct use (e.g. use of Creative Commons licenses). Passing mentions are ignored. | Indirect |
| Unknown (UNK) | Not enough information to classify. | Unknown |
Feedback
- See “Characteristics of selected open infrastructures” in this report.
- See “Characteristics of (selected) open infrastructures” in this report for a brief introduction to Infra Finder, and Collister et al. (2024) for a fuller account. Infra Finder is available at https://infrafinder.investinopen.org.
- We harvested grant award data directly from the websites of the following funders: Alfred P. Sloan Foundation, Andrew W. Mellon Foundation, Arcadia Fund, Bill & Melinda Gates Foundation, Chan Zuckerberg Initiative, Gordon and Betty Moore Foundation, Institute of Museum and Library Services, Leona M. and Harry B. Helmsley Charitable Trust, National Endowment for the Humanities, Robert Wood Johnson Foundation, Social Sciences and Humanities Research Council, The Wellcome Trust.
- https://www.nsf.gov/awardsearch/download.jsp
- Two of the 22 funders with data available from IOI’s 2022 analysis, Arnold Ventures and the Simons Foundation, no longer offer straightforward access to award data in bulk. Arnold Ventures has been an important funder of the Center for Open Science (home of Open Science Framework, OSF), and many of its earlier grants were to that organization. We did scan more recent 990 forms for Arnold Ventures and did not encounter any additional awards to OSF in 2021 or 2022, although it is possible there were awards to other OIs of interest (we did not search for them). Awards from the National Institutes of Health (NIH) were also reported in IOI’s 2022 dataset. In this iteration we were unsuccessful in applying our harvesting methods to the NIH’s award database due to its sheer size, but we were able to retrieve some data via OpenAIRE. This almost certainly results in missing some relevant grant awards from NIH.
- https://data.ecb.europa.eu/currency-converter
- https://www.exchangerates.org.uk/
- State of OI grant funding data dashboards: https://investinopen.org/data-room/grant-funding-data-dashboard
- See “Characteristics of selected open infrastructures” in this report.
Find us on