Vital open infrastructures in a volatile moment
Guiding questions
- What role can we, as OI stakeholders, play in order to prevent real disruptions and losses on a broad scale in a moment of funding volatility that is impacting so many elements of the research ecosystem?
- How numerous and diverse, or concentrated and related, are the OIs that respondents consider “vital”? How many categories of infrastructure do they include, and how do they connect to each other?
- What relationships are implicit and crucial in our open infrastructure ecosystem (e.g., between OIs, or between OIs and different supporting/using groups), and how can we surface these for action without comparing or ranking these infrastructures in the process?
- How can stakeholders come together across the ecosystem in this critical moment to better understand and bolster support for these OIs?
Key insights
- The volatility of the current funding landscape in the US may directly and indirectly affect OI organizations and services tied to research and scholarly communication worldwide; we need ways to study, understand, and decisively act across stakeholder roles and geolocations to bolster and strengthen these critical resources.
- We suspect that data about infrastructure use could be layered with additional information about the infrastructures, including the types of data we collect in Infra Finder, to tell much more nuanced stories about the types of relationships and potential engagements possible between OIs. - This could help to identify groups of infrastructures that are best suited to work closely together, something that may help to reduce cost, increase visibility, and/or achieve scale for OIs in a challenging funding climate.
- Funding is an obvious and widespread concern, but not all organizations and services in Infra Finder (and in the wider community) face the same types and levels of threats. Specificity is key.
Introduction
At IOI, we’re increasingly concerned about how the volatility of the current funding landscape in the US may directly and indirectly affect open infrastructure (OI) organizations and services tied to research and scholarly communication.
As we’ve described elsewhere in this report, in the first 100 days of the new administration in the US, we’ve borne witness to extreme policies and actions, including billions in terminations of federal grants and contracts; shuttering of agencies including USAID, NEH, and IMLS; and a mounting series of direct attacks on US universities, including politically motivated pauses/threats to cancel additional billions of active grants and contracts and other federal funding sources.
The implications of these and other US-based actions on open research practices throughout the world are significant. Prior to this moment, we were already seeing cuts to open science in parts of Europe and Latin America; but now, as the world deals with the collateral damage done by US withdrawals from various defense, foreign aid, and unification environments, we expect that some of the impacted countries will be motivated to divert even more of their available resources in these directions, potentially to the detriment of their funding for research and science.
To call this “disruption” is an understatement. The landscape is quickly and radically changing in ways that seem certain to negatively impact multiple funding streams for OIs worldwide. Understanding which open infrastructures are at risk at pivotal moments will be key to preventing real disruptions and losses on a broad scale.
Getting access to information about what is most at risk is difficult: it depends on many developing external factors, as well as how secure/embedded/resilient each OI is. And while much attention has been given to the ways this will impact higher education (especially in the US) and scientists and other researchers, far less attention has been given to the way these changes will impact the bottom lines and narrow margins of OIs serving the research community, including hosted or embedded groups and free standing organizations that rely on membership revenues from libraries.
In February we blogged about our concerns and invited infrastructures, particularly those featured in Infra Finder,[1] to share their stories with us. We received responses[2] and we heard additional stories through our personal networks. Based on both formal and informal reports, we gathered that most OIs were (painfully) aware that their own business models were likely to be challenged or compromised by the massive changes underway regarding US federal funding for research and higher education. They also were aware that they didn’t know how to predict, forecast, or respond because the changes (and court actions to fight those changes) were still unfolding at dizzying speed. Most OIs are still assessing their own levels of risk, as well as a timeline of when various risks are likely to happen.
We wanted more “in the moment” information from the field to better inform our own approaches to advocating for and supporting open infrastructures. In March 2025, our team designed a poll for limited circulation, only to IOI’s newsletter subscribers,[3] in what we knew was a very challenging moment for open infrastructures and those who depend on them. These subscribers include many different types of OI stakeholders, including those who build and manage infrastructure, as well as those who use and/or fund infrastructure. To mitigate potential concerns, we designed the poll so that:
- It was brief, with five questions, only two of which were required.
- It had clear boundaries and purpose, centering explicitly on the then-104 infrastructures featured in IOI’s tool, Infra Finder.[4]
- The email invitation, newsletter blurb, and poll intro briefly and consistently stated, “This poll is meant to help IOI identify groupings, trends and scenarios;” and promised respondents that results would “not be used to rank, exclude, or create competition among the breadth of open infrastructures that support our community.”
Even still, it was hard to push the “send” button that launched it out to 1,000+ of IOI’s closest, direct contacts for a two-week period. We knew some recipients might misunderstand our intent; we knew others might be irritated by our premise that US funding volatility could unsettle open infrastructures (especially infrastructures outside of the US). But after running the poll, we’re glad we took the risk of putting this quick study out into the field. We’re also grateful for those that responded for providing us with data that we could use to test a few really important things in this critical moment. We haven’t decided what our next steps will be, but we are seeking ways (and partners!) for further study and surfacing of pertinent, actionable details about what impact volatility is having on OIs and on how we can best support their needs so that they can continue supporting the research ecosystem. Please reach out to us at research@investinopen.org if you have ideas or interest in working with us on this.
Methods
On March 31, 2025, we sent out a quick, anonymous poll via email just to IOI newsletter subscribers, a list of just over 1,000 email addresses.
Poll design
The Jotform-based poll had five questions, of which only two were required (indicated below by an asterisk):
- Which of the following infrastructures are most vital for your work? Choose from the Infra Finder list a total of up to 5 selections.* (see Appendix A for this list)
- In which country or region/geolocation do you work (primarily)? If you prefer to list this differently, please add it under Other.* (with checkboxes for: Africa, Asia-Pacific (APAC), Europe, Latin America, Middle East, North America (non-US), and United States, plus a write-in line for “Other”)
- Which best describes your focus/work area most of the time? (with checkboxes for: Data science and/or metadata, Funding, Libraries, Publishing (scholarly/ academic/research), Research (any discipline), Research administration, Scholarly communications (non-publishing), Teaching, and Technology, plus a write-in line for “Other”)
- If you were unable (for any reason) to use the infrastructures you selected, what would the result be for your work (rate 1-5, where 1 is no bad effects and 5 is catastrophic)?
- If you have additional comments, please use the space below. We are particularly interested in infrastructures that you find valuable to your work, your view on the current funding environment for infrastructures specifically, and/or any thoughts about your discipline or field’s use of open infrastructures.
As described above, our intent was to query those with connections to IOI (as evidenced through their newsletter subscriptions) about a distinct set of important OIs that are featured in IOI’s Infra Finder. Particularly given the complicated set of definitions that emerge around the term “open infrastructure,” we knew that we needed clear boundaries and a concrete set of selections to ensure consistency in our poll results.[5]
We structured the poll so that it intentionally focused on trends, not on rankings or other markers pertaining to single infrastructures. We also chose a very specific term, “vital,” meaning absolutely necessary or essential, for our main question (“Which of the following infrastructures are most vital for your work?”) to focus respondent attention on what matters to their own work, no matter what type of work they do or how esoteric or mainstream that work might be. We did this for many reasons, including the diversity of roles in our respondent pool (librarians, publishers, researchers, technologists, funders, etc.) and to try to sidestep or avoid the meanings that other questions might evoke. For example, if we had asked about what infrastructures respondents use the most or what infrastructures they consider to be most important, either generally or by functions (e.g., repository software) or focal areas (e.g., book publishing), we would be assessing how popular or central a particular infrastructure, or even a set of infrastructures, might be. Again, we were not interested in rankings; our aim was to get at something more important to us and trickier to surface: how numerous and diverse are the infrastructures that respondents consider “vital”? How many categories of infrastructure do they include, and do they relate to each other in interesting ways?
We created the poll to surface connections, especially the breadth, spread, concentration, and focus of the OIs “most vital” to people in different geographic locations and professional roles. To protect the infrastructures from being subjected to popularity rankings in other contexts (intentional or not), we have also made a very difficult (and rare for IOI) choice to not share this data as an open dataset.
Respondents
170 respondents (a response rate of approximately 17%) completed the poll in the two-week period during which it was made available. Poll respondents selected 80 OIs — nearly three quarters of all infrastructures in Infra Finder. Their selections demonstrate the wide and distributed usage of many infrastructures in IOI stakeholders’ daily work, not just tangentially but in ways that these respondents described as “vital.”
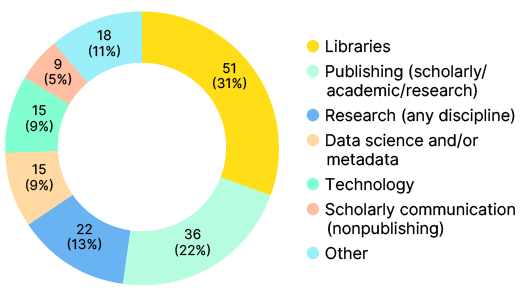
Nearly all respondents (166) answered the optional work role question; responses skewed heavily toward scholarly communications work, including librarianship and publishing. Most respondents identified their focus and/or work area as libraries (51 respondents, 31%); additional respondents cited publishing (36 respondents, 22%), research (22 respondents, 13%), data science and/or metadata (15 respondents, 9%), technology (15 respondents, 9%), and scholarly communication (9 respondents, 5%) as their focus or work area.
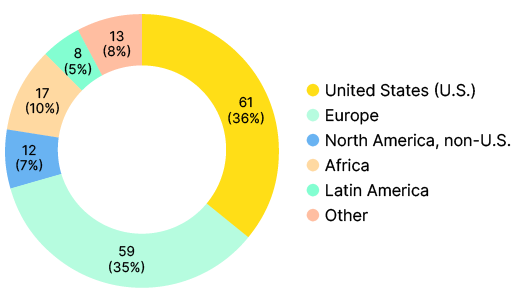
Given that the US funding landscape is driving the upheaval in the research enterprise, we specifically listed the US as the only country-level response in the region/ geolocation question. We also invited respondents to name their location by country or another designation using “Other.” Over a third of respondents (61, 36%) said they work in the US (at least primarily). An almost equal amount (59, 35%) identified Europe as their work location. An additional 10% (17) selected Africa and 5% (8) selected Latin America. North America (non-US), Asia-Pacific, and the Middle East were all represented in the responses as well, and six individuals used “other” to write in Oceania, United Kingdom, and International.
Analysis
Wherever reasonable herein, we avoid identifying specific OIs in order to avoid fostering a ranking tone or lens on the results.
We began our work by studying the degree of concentration in the dataset overall, and then analysing these according to respondent geolocation and respondent role to see what, if any, differences were detectable. By the term concentration, we mean how compact or how spread out the results are. In particular, we sought distinct patterns and trends in this concentration, first in the dataset as a whole, and then sorted by geolocation and by role, in terms of the overall distribution of answers. For example, we wanted to see if respondents named a small number of OIs far more often than others, or if the distribution of respondent answers was more evenly spread, with many open infrastructures cited at a relatively average rate. We also wanted to see how long the “long tail” was, whether it included many or few infrastructures with lower counts (e.g., 1-3).
We then sought to understand the interconnectedness of the infrastructures in the set, first by one infrastructure was co-named with another, and then by constellations of infrastructures based on patterns of interrelation and trends in OI co-occurrence. By co-named, we mean how often infrastructures were listed together by single respondents (e.g., bioRxiv and Zenodo were co-named 10 times; DOAJ and OJS were co-named 21 times). By constellations, we mean how deep the relationships between particular sets of OIs are (in our case, using Gephi’s[6] modularity function to detect “communities” within the dataset).
We used Gephi to visualize co-named pairs of infrastructures in the dataset; we also used Gephi’s modularity function to detect constellations of OIs. We adjusted the modularly parameters to create visualizations of four and seven communities in order to identify meaningful constellations. We used the Forceatlas2 layout to format the visualizations.
Co-named: How often are infrastructures listed together by single respondents.
Constellation: How deep are the relationships between particular sets of institutions.
Because we remain concerned about how the poll data could be used and interpreted out of that Gephi provides through size of node (e.g., making infrastructures that are cited more often larger, and those cited less often smaller) and thickness of lines (e.g., linking infrastructures that are co-named more often with thicker lines and those that are co-named less frequently with thinner lines) in all of our images included herein. We do share infrastructure names and lines between them (standard sized), as well as color coding for some of the constellations that appear within the data, as these details reveal far less about ranking than they do about relationships.
Finally, we analysed the reported effect of being unable to use the OIs and the open response “additional comments” section. Results and discussion are included below.
Results
Infrastructure concentration
Our first research question related to the concentration[7] of responses to the initial poll question (Which of the following infrastructures are most vital for your work? Choose from the Infra Finder list [below] for a total of up to 5 selections) as measured in several ways.
We had 170 total responses to this question. Most (145) of these included the maximum allowed (5 infrastructures); however 25 of our responses included fewer than 5 infrastructures (4 respondents included 4 infrastructures; 6 respondents included 3 infrastructures, 10 respondents included 2 infrastructures, and 5 respondents included only 1 infrastructure). The total number of times the 80 infrastructures were selected across all 170 responses was 784.
Overall concentration of infrastructures
First, we wanted to understand the overall concentration of infrastructures.
Our 170 respondents named 80 infrastructures between 1 and 59 times. On average, each infrastructure was selected by 10 respondents. The median number of times that each infrastructure was selected was 4.
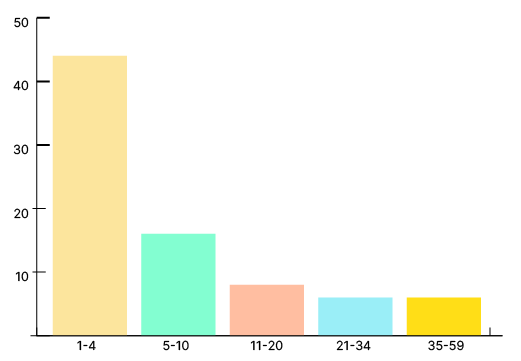
As depicted in Table 1, data was not highly concentrated around a small number of infrastructures; instead it was broad and included a long tail of infrastructures named 1-2 times. More than half of the 80 selected infrastructures were named between 1 and 4 times[8] (44, or 55%); 16 were named 5-9 times (20%), 8 were named 10-20 times (10%), and 6 were named to each of the two highest categories, 21-34 times (8%) and 35-59 times (8%). The relatively narrow set of 12 infrastructures named more than 20 times stand out as especially “vital” to many respondents. These may be worth further investigation in a future study to determine if this finding holds with a broader pool of respondents.
None of these results are major surprises, though the consistency with which many people across stakeholder groups selected the same 12 infrastructures was relatively striking. While we are not sharing the names of those 12 infrastructures, as per earlier explanations, the range of functions represented within them included the following: computing library (1); discovery system (3); index or directory (2); open scholarly dataset (3); publishing system (1); repository service (1); repository software (1); and standard, specification or protocol (3).[9] These 12 infrastructures also represented a diverse range of content types (data, software, journals, monographs, archival, preprint, PIDs, citations) and functions (creation, analysis, dissemination, deposit, discovery). The most notable function that was missing in this diverse set of most-cited infrastructures was digital preservation.
Concentration of infrastructures by region/geolocation
Second, we wanted to see if there were notable differences between which infrastructures were selected by respondents from different regions/geolocations. This comparison was complicated by the large differences in the number of respondents and (as a result) the number of infrastructures selected.
As shown in Table 1, overall, we had similar numbers of respondents and named infrastructures from the US (61 respondents, 60 infrastructures) and Europe (59 respondents, 48 infrastructures), which allowed for limited comparisons across these geolocations. While the number of respondents (17) and named infrastructures (33) was much lower in Africa, which was the next-largest respondent geolocation, we also drew careful comparisons across the US, Europe, and Africa where these seemed meaningful.
We noted the following counts across the US/Europe/Africa responses:
The biggest surprises, perhaps worth further investigation, were the differences we found in repository services, repository software, and publishing system counts across these three locations. Open repository software and tools listed in Infra Finder were cited over three times more by US-based respondents than by European respondents and six times more than by African respondents (this is a lot even given the notably different respondent sizes in Europe and Africa). Publishing systems in Infra Finder, on the other hand, were much more often cited by respondents in Europe (33 times) than by US respondents (18) or African respondents (10); this size gap between US and European respondents is especially interesting. Explanations for these differences may be related to Infra Finder’s current coverage of repository and publishing platforms and tools; they may also signal differences in reliance on open infrastructures for these functions in different regions/geolocations.
We also analysed which infrastructures were selected by respondents across either two or all three of these geolocations. The common core between the US, European, and African respondents in this poll included 23 OIs; licensing tools, publishing tools, and key metadata standards and protocols featured as the most common types of infrastructures in this core grouping. There were also 38 infrastructure selections in common between the US and Europe, 25 infrastructure selections in common between the US and Africa, and 25 infrastructure selections in common between Europe and Africa. Nearly a third of all named infrastructures in the dataset (32%) were held in common between these three regions/ geolocations, demonstrating strong support for a set of backbone infrastructures within this limited study.
Although the number of named infrastructures is relatively similar between the US and Europe, concentration of these infrastructures was higher in Europe, with only 49 infrastructures named, and concentration was lower in the US, with 60 infrastructures named.
Infrastructure concentration by role
Third, we looked for differences based on self-identified roles. The poll provided nine options, plus a write-in option marked “other.” The highest scoring categories were Libraries (51, or 31%), Publishing (scholarly/academic/research (36, or 22%), Research (22, or 13%); Data science and/or metadata (15, or 9%), and Technology (15, or 9%); we concentrated our analysis primarily on these categories accordingly.
We found that distinctions in infrastructure selection were both clear and meaningful across these role types. The data show how important it is to include the perspectives of multiple stakeholder types/roles in analyses of OI tools, and also in any planning activities undertaken at a meta-level to understand and/or respond to OI needs. People in different roles rely on different infrastructure components.
We noted the following counts for the main five role types we analysed:[10]
We also analysed the breakdown of roles by region/ geolocation (and vice versa) and found that the distribution of roles across regions/geolocations may complicate some of these findings. Specifically, we had a higher number of librarians in our United States respondents, and a higher number of publishers in our European respondents.[11] This could help to explain some the differences we see in reporting of “Repository software” (much higher overall in the US than in Europe, and also much higher overall in librarians than in publishers) vs. “Publishing system” (much higher overall in Europe than in the US and also much higher overall in publishers than in librarians).
Additional observations we make about this limited data include:
- Respondents from three of the main roles we analysed (Libraries, Publishing, and Research) share a clear dependance on open licensing and copyright tools. This dependence was far less pronounced in the open infrastructure selections by Data science/metadata or Technology respondents; however, Infra Finder does not yet include any open source licensing/copyright tools. If such tools had been represented in Infra Finder, we expect the selections could have risen for these stakeholder groups.[12]
- Respondents from Libraries and Technology roles were more likely to be invested in repository software; as were a few respondents from Research. Respondents from Publishing and Data science/metadata almost never selected Repository software, but did indicate their reliance on Repository services. This is a crucial distinction that may have important implications for what open infrastructures are supported and how. Those who partake in services may not be investing in the tools that those services rely upon, both in terms of their volunteer contributions of time and energy and also in terms of financial contributions.
- Respondents across the board rely heavily on Standards, specifications and protocols and PIDs; however, respondents from Publishing roles seem to be disproportionately lighter in their selection of these elements as “vital” for their work. Given the degree to which the current scholarly communication ecosystem, perhaps especially publishing, relies upon these standards, this may be worth deeper exploration in future studies to understand how visible these are for publishers and why they may not have been top of mind for these respondents.
- Respondents from Libraries selected larger numbers of specifications, standards and protocols, repository software, data tools, and catalogues; however, they selected publishing tools much more rarely. This group also evidenced the highest selection of preservation tools and services.
- Respondents from Research often selected the connective tissue, like standards, specifications, and protocols; they seem to be most focused on Discovery services and on Repository services.
Infrastructure connections and constellations
After analysing the concentration of the data, we sought to understand how the infrastructures represented in the results were connected, both in terms of co-naming (e.g. how often single respondents have included the same infrastructures among their up-to-five answers) and in terms of constellations, or relatedness of particular sets of infrastructures based on their patterns of co-occurrence.[13]
Co-named infrastructures
Part of what motivated this poll was our hypothesis that there would be meaning in the relationships between named infrastructures that we could begin to see, even in this relatively small and informal study. We have struggled with how best to share what we are learning without putting undue emphasis on particular infrastructures. We know that the weightedness of the connections between infrastructures (e.g., the difference between two infrastructures being cited together once versus two infrastructures being cited together 15 times) is a crucial marker of relationship, one that we could study on the basis of such factors as interdependence (e.g., one infrastructure is built upon another infrastructure); relatedness (e.g., named infrastructures interoperate); and other forms of connection (e.g., two named infrastructures often support the same content workflow, or two named infrastructures perform related functions, or even two named infrastructures were created by or are organizational hosted by the same group of people).
We see each of these scenarios and many more in the 1391 pairs identified in this dataset. Below, we focus on a couple of specific case studies that we think illustrate interesting trends. We use pseudonyms to mask the identities of the infrastructures in these case studies to keep the focus on the relationships we see, not on how many times particular infrastructures were named.
Each pair of infrastructures (e.g., two infrastructures named by the same respondent) appeared together between 1 and 21 times in this dataset. Although the vast majority of pairings only occurred between 1 and 3 times, 20 such pairings occurred between 10 and 15 times; another two pairings occurred more than 15 times. Some of these high-match pairs were relatively predictable cases of two heavily selected infrastructures coming up together repeatedly (e.g., two of the 12-most- often-selected infrastructures). Some were not. We’ll look at a couple of case studies representing different situations below.
Case 1: Common match, one less-selected infrastructure (X and Y)
In the first case, we see a single pair that appears together 10 times. The “match” in this case is between two Repository services. One of the infrastructures (X) is among the 12 infrastructures that were selected most often by respondents; the other (Y) is not. Looking back to the master data for context, these two matched up as a pair nearly every time the less-selected infrastructure (Y) appears in the data set. That less-selected infrastructure (Y) is co-named with 24 other infrastructures in total; many of these lean more toward what we might categorise as data analysis and researcher tools, including Open scholarly dataset, Computing library, and additional Repository services (notably, not Repository software).
The co-occurrence and co-naming in this case likely relates to the slightly more specialized nature of the less-selected infrastructure (Y), which is closely tied to a disciplinary function. Respondents who select this Y infrastructure may be focused on specific disciplinary frameworks. Y was selected more often with similar, though not at all interrelated, infrastructures (e.g., the pairs do not share underlying code, nor do they interoperate or connect explicitly together. The relationship seems to be based on the substance of the research topic and type, and it is one directional. Y responses tended to include X, but the reverse was much more seldom true. X, the more often selected infrastructure, pairs with a total of 44 other infrastructures (with 150 matches).
Case 2: Common match, more-often selected infrastructures (A and B)
Looking across the data, another match that occurred 15 times stood out in our analysis because the pair was so often related with other elements in the same small field of monograph/book publishing. These two infrastructures were both among the 12 infrastructures that were selected most often by respondents.
What becomes interesting in this case is that the other infrastructures that are co-named with A and with B are, almost without exception, part of the same “family” of book publishing and book discovery infrastructures. In this case, the familial relationships between the infrastructures extend to regular grant-funded partnerships and deeply collaborative work. In essence the pairing, when considered in context, is part of a close-knit community of tools and services that regularly interact. One member of the pair (we’ll term it A) pairs only with 20 other infrastructures (with 67 total matches), despite its high selection. The other (B) pairs with 23 infrastructures (with 54 total matches), again despite its high selection. The density of any single pairing (between A and 20 infrastructures and B and 23 infrastructures) happens six or fewer times, in contrast to the A/B pair appearing together 15 times.
By contrast, most high-selection infrastructures have a much broader array of matches, e.g., one of the Open scholarly datasets that respondents selected a similar number of times to both pairs with 36 infrastructures (with 106 total matches).
Constellations
As we designed the poll, we hoped to be able to identify which sets or groupings of infrastructures most often appear together. We term these groupings constellations and we suspect this type of analysis might provide the most nuanced and interesting stories about the relationships between OIs, particularly if this data were layered with additional information about the infrastructures, including the types of data we collect in Infra Finder regarding each infrastructure’s business/organizational model, governance model, location, code language(s), dependencies, and other key facets. This could identify groups that might be well suited to work more closely together, especially if that helps to reduce cost, increase visibility, and/or achieve scale.
We adjusted Gephi’s modularity parameters to create the visualization we share below. As we describe elsewhere, we have standardized the line weights and the sizes of individual infrastructures in the images we share herein in order to reduce the temptation to see the infrastructures as “larger” or “smaller” and to instead focus attention on the types of constellations we can start to see using Gephi’s color-coded “communities” as our base.
The patterns and trends that are displayed here show a couple of interesting elements that we expand on briefly below.
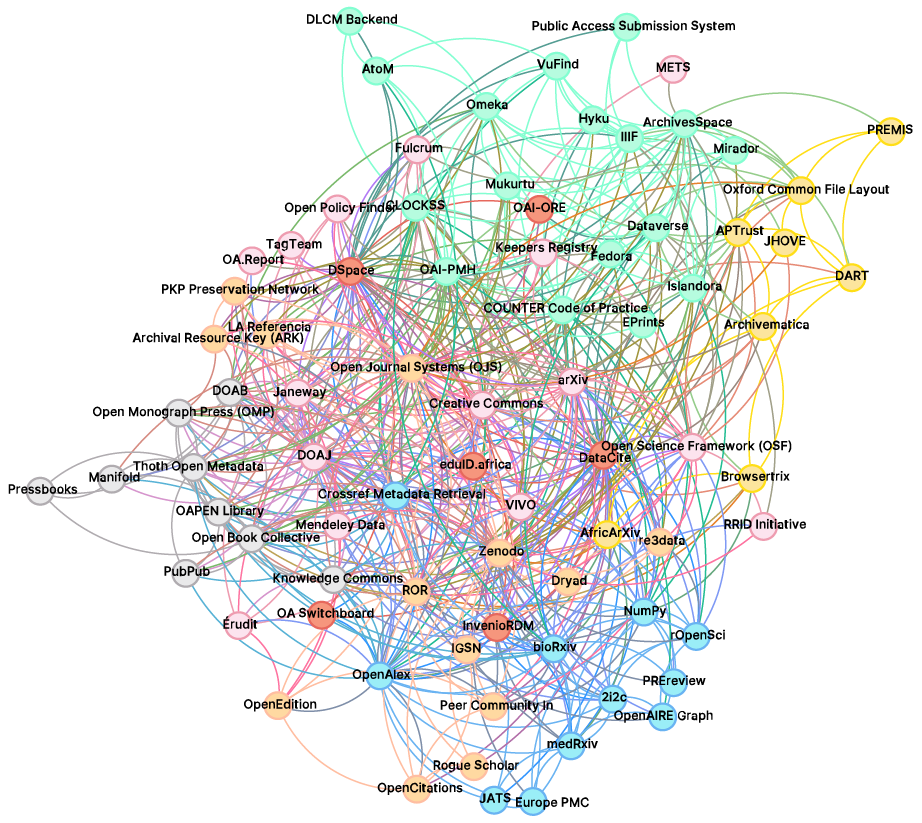
First, interconnectivity between infrastructures is dense, even with the very basic data we gathered in this poll. (“Which of the following infrastructures are most vital for your work?”) We didn’t ask respondents to actively share groupings, nor have we added other data (e.g., details from Infra Finder about business or organizational model or location) to complement the poll responses. Just based on the relationships implicit in 170 respondents’ answers that included up to five infrastructures each, we can already start to see meaningful patterns.
As one example, one set of “book” publishing components appeared together in tight accord across respondent answers. When one or two of these infrastructures were selected, others in this grouping tended to also be present. This is immediately visible in the visualization (Figure 4) — the left middle constellation includes elements like Open Monograph Press (OMP), Manifold, Thoth, Open Book Collective, OAPEN Library, PressBooks, and DOAB, as well as Knowledge Commons and PubPub, both of which lean more toward humanities and social sciences publishing and community building.
Another interesting pattern is revealed by looking at the Digital Preservation and Digital Asset Management elements. These don’t all correlate tightly with each other, e.g., CLOCKSS and PKP Preservation Network are both nestled in with journal publishing platforms and standards that each one is often paired with in workflows. One distinctive set in the upper right provides another recognizable preservation constellation, involving APTrust, PREMIS, JHOVE, DART, Keepers Registry, and Archivematica, all of which factor into archival collection, curation, and preservation workflows.
Other constellations emerge from this picture with journal publishing relationships showing up in pink (platforms like Erudit, Janeway, and OJS, as well as services including DOAJ, Creative Commons, and Keepers’ Registry), Catalogs (DOAJ, DOAB), metadata schemas/standards/ collection and reporting (OpenAlex, Crossref Metadata Retrieval, ARK). A blue cluster in the lower right focuses more on science and data tools, standards, services, and environments including repositories and review platforms (EuropePMC, bioRxiv, medRxiv, PREreview, and rOpenSci), and tools (NumPy, 2i2c).
These constellations are far from perfect — data-oriented repositories, discovery tools, frameworks, and standards tend to be scattered throughout, including Dataverse, Dryad, re3data, DataCite; metadata standards and exchange protocols likewise tend to be more dispersed in this graph. Still, this initial depiction demonstrates that even the relationships represented in lists of five “vital” infrastructures as selected by 170 respondents are strong enough to visibly appear in simple visualizations.
IOI is interested in undertaking further investigation into what we can learn through additional research, particularly coupled with the data (and business intelligence) embedded currently in the Infra Finder tool, to help point to promising “backbones” of common and/ or complementary traits between existing infrastructures. Given the volatility of the current US research environment in particular, establishing how infrastructures function in relationship with each other can help them to raise their visibility and connectedness. This may be helpful in creating new fundraising mechanisms that work with groups of institutions (e.g., library consortia or disciplinary societies) that share a vested interest in specific sets of infrastructures. It may also help OIs find ways to team up to gain adoption, scale, and reinforce, rather than compete with, each others’ assets, skills, and operational environments.
Infrastructure reliance level
One poll question asked about the effect of being unable to use the OIs respondents selected, on a scale of 1 to 5 where 5=catastrophic and 1=no bad effects. More than 90% of respondents answered this optional question; of those, more than 80% selected 5 or 4 (catastrophic or very detrimental effects). Only 11 respondents (7%) indicated that the loss of these infrastructures would have only mild or no bad effects, with answers of 2 or 1.[14]
Open responses
Nearly a quarter of respondents (41; 24%) replied to the final, optional question in the poll asking for additional comments. The full text of the question helps provide context for some of the results:
If you have additional comments, please use the space below. We are particularly interested in infrastructures that you find valuable to your work, your view on the current funding environment for infrastructures specifically, and/or any thoughts about your discipline or field’s use of open infrastructures.
10 respondents took the opportunity to express the difficulty in being limited to selecting only five organizations from the Infra Finder list in the poll. Nineteen also named other infrastructures on which they rely (some of those named are included in Infra Finder, others are not; those are noted below with an asterisk):
- 2i2c
- Avalon*
- Biomed News*
- CORE
- COUNTER
- Creative Commons
- CRediT*
- Crossref
- DataCite
- DOAB
- DOAJ
- Dryad
- DSpace
- Fedora
- Figshare*
- Hyrax*
- JATS
- La Referencia
- Latindex Catálogo*
- NumPy
- OAI-PMH
- OJS
- Open Policy Finder
- OPERAS*
- ORCiD*
- Peer Community In
- PID networks (general)
- Problematic Paper Screener*
- PubMed*
- PubPeer*
- R*
- RAiD*
- Redalyc*
- Research Data Alliance (RDA)*
- RePec
- Retraction Watch*
- ROR
- Samvera*
- SciELO*
- Software Heritage*
- Thoth Open Metadata
- Unpaywall*
- VuFind
- Wikimedia Foundation*
- Zenodo
*Names with an asterisk are not currently listed in Infra Finder.[15]
A few respondents called out efforts of note in their country or region and/or amplified the resource needs in still-underrepresented regions, including Africa/ sub-Saharan Africa, Argentina, Ethiopia, the Global South and Nigeria (each of which was named explicitly in responses).
Some comments discussed the layered, interrelated nature of OIs, noting that users may be one or more steps removed from an infrastructure and as a result, they may not realize they are reliant upon it. Others wondered what the appropriate granularity is for naming what they rely upon — a specific product or service or the parent organization, for example. Some respondents made clear distinctions between infrastructures they find most vital and others they use, admire or otherwise want to support. Many provided context for their use cases, for example, relying on open infrastructures they personally work on or contribute to.
It’s difficult to know whether or to what extent poll responses reflect the particulars of Infra Finder entries or (as seems more likely) if these names call to mind more personal associations for respondents. For example, DataCite encompasses Make Data Count and it is part of the governing collaborative of ROR. Make Data Count does not have its own Infra Finder entry. If a respondent named DataCite as vital for their work, does that reflect reliance on Make Data Count? On ROR? PKP (Public Knowledge Project) appears in four Infra Finder entries; all of its services rely on PKP. How to count ‘PKP’ in poll results and what kind of follow up to consider based on the responses to each entry are two different questions. What is clear is that there is a lot of dependency among open infrastructures (and their communities).
A few respondents articulated the power and promise of what open infrastructure can do, beyond specific organizations, including supporting the need for academic and knowledge sovereignty. Others provided specific thanks to infrastructures on which they depend or that they see doing important work to make access to knowledge more equitable. One respondent noted something we found particularly resonant — that the loss of the humans behind maintenance of local instances of OIs and of the OIs’ own development work would be more catastrophic than losing the infrastructures themselves.
Discussion
Gaining the necessary vantage point for interdependencies in the larger landscape requires first understanding how “open infrastructure” serves research and scholarship, including key characteristics such as what they do, where they are based, how they are funded, and who owns, governs, or controls them. Looking at these factors in groupings of infrastructures — constellations — is meant to probe commonalities and differences that may be points of vulnerability and strength in networks of infrastructures surfaced by poll results.
As a network of interconnected stakeholders, we — the funders, builders, and users of open infrastructure — have choices to make. We cannot support everything that we have built to date. Doing so is not supporting “infrastructure,” it is more likely to increase clutter and distraction in the landscape. Our knowledge and research landscape is rapidly changing. What we can choose is how we want to change — but we only get to choose how by taking deliberate steps along an active path rather than passively waiting to first see what gets discontinued or what dies on the vine.
Infrastructure relies on meeting broad-based needs with community-wide investment and adoption. Especially in a moment in which major sources of funding are disappearing and long standing partners (e.g., government) are no longer consistent or trusted, we need to differentiate between the tools, protocols, services, and environments that are needed by many, versus those that satisfy more specific (though still crucial) needs of a smaller subsets of research communities. These two types of resources need different investment structures and strategies to succeed.
What running this poll in this historical moment has largely done for us at IOI is to convince us that these are questions we have to be asking in new ways, even though (or maybe because) they are subjective and very hard to work with and/or tally without distortion.
The poll approach provides insights that we hope can be used with other data, including sources like Infra Finder, to give a cogent sense of what people most need, care about, and value alongside other information about design, coding language, type of openness, community engagement, governance, usage and adoption levels, dependencies, interoperability, financial stability, hosting model, values (e.g., transparency, openness), and many other characteristics that matter a great deal when trying to create a plan for the future sustainability and care of our OIs. If you are interested in working with us as we seek new vantage points and perspectives, please let us know.
Appendix A: Infra Finder list
The first question in the poll asked:
Which of the following infrastructures are most vital for your work? Choose from the Infra Finder list for a total of up to 5 selections.
The following is the list of the 104 open infrastructures from which respondents could choose, ordered alphabetically as it was in the poll:
- 2i2c
- Academic Preservation Trust (APTrust)
- AfricArXiv
- Arches Heritage Data Management Platform
- Archipelago Commons
- Archival Resource Key
- Archivematica
- ArchivesSpace
- arXiv
- AtoM
- bioRxiv
- BrCRIS
- Browsertrix
- CLOCKSS
- CollectiveAccess
- CORE
- COUNTER Code of Practice
- Creative Commons Licenses
- Crossref Metadata Retrieval
- DART (Digital Archivist’s Resource Tool)
- DataCite
- Dataverse
- Directory of Open Access Books
- DLCM Backend
- DLCM Portal
- DOAJ (Directory of Open Access Journals)
- dokieli
- Dryad
- DSpace
- DuraCloud
- eduID.africa
- Episciences
- EPrints
- Érudit
- Europe PMC
- FAIRiCat
- FAIR Signposting
- Fedora
- Fulcrum
- Galaxy
- Hyku
- IIIF
- International Generic Sample Number (IGSN)
- InvenioRDM
- iRODS
- Islandora
- Janeway
- JHOVE
- Journal Article Tag Suite
- Keepers Registry
- Knowledge Commons
- LA Referencia
- Manifold
- medRxiv
- Mendeley Data
- Metadata Encoding and Transmission Standard (METS)
- Mirador
- Mukurtu CMS
- MyCoRe
- NumPy
- OAPEN Library
- OA.Report
- OA Switchboard
- Omeka
- OpenAIRE Graph
- OpenAlex
- Open Archives Initiative Object Reuse and Exchange (OAI-ORE)
- Open Archives Initiative Protocol for Metadata Harvesting (OAI-PMH)
- Open Archives Initiative ResourceSync Framework Specification
- Open Book Collective
- OpenCitations
- OpenEdition
- Open Journal Systems (OJS)
- Open Monograph Press (OMP)
- Open Policy Finder (formerly Sherpa Services)
- Open Preprint Systems (OPS)
- Openverse
- O Portal Brasileiro de Publicações e Dados Científicos em Acesso Aberto (The Brazilian Open Access Publications and Scientific Data Portal) (Oasisbr)
- OSF (Open Science Framework)
- Oxford Common File Layout
- Peer Community In
- PKP Preservation Network
- PREMIS Data Dictionary for Preservation Metadata
- PREreview
- Pressbooks
- Public Access Submission System
- PubPub
- pyOpenSci
- re3data.org
- REDI
- Renku
- RePEc
- Research Organization Registry (ROR)
- Research Resource Identification Initiative
- Rogue Scholar
- rOpenSci
- RSpace
- Sciety
- Synapse
- TagTeam
- Thoth Open Metadata
- VIVO
- VuFind®
- Zenodo
Feedback
- https://infrafinder.investinopen.org
- We briefly chronicled the compelling responses in a blog post at https://investinopen.org/blog/elevating-open-research-insights-from-the-responses-to-our-call-to-action/
- We initially considered creating a survey for wider input; we worried about the scope and what stories we would be able to tell responsibly if we sought out a broader, more general respondent pool. Pending the outcome of the current, limited-scope study, we may launch a larger study in the future, likely in partnership with additional organizations.
- Infra Finder currently features more than 100 open infrastructures serving research and scholarship. These open infrastructures can be viewed as corollaries to physical infrastructure like roads and bridges: They are elements that undergird the way knowledge moves among creators, reviewers, service providers (commercial and non-profit) and users. They include digital and technical components (e.g., repositories, platforms, aggregators, and search-and-discovery systems); standards (e.g., frameworks, identifiers, metadata schemas, and a host of best practices, norms, assessment, and certification programs); and social “glue” (e.g., associations, working groups, and collaborative networks). https://investinopen.org/data-room/about-infra-finder/
- Kaitlin Thaney. “What we talk about when we talk about ‘open infrastructure,’” Katina, Jan 15, 2025. https://katinamagazine.org/content/article/open-knowledge/2024/talk-about-defining-open-infrastructure
- https://gephi.org/
- By the term concentration, we mean how compact or how spread out the results are.
- As Infra Finder grows over time, this long tail is likely to increase as well; it is no small factor in considering what infrastructures are at risk in the current landscape. Within the poll results, some larger constellations even have their own long tails.
- Here and throughout, numerical counts of “functions” include multiple functions for single infrastructures. Our categorization of infrastructures is based on Infra Finder’s solution categories.
- To place infrastructures into normalized categories (repository service; repository software; discovery system; publishing system; standard, specification, or protocol; or open scholarly dataset) we relied on Infra Finder’s solution categories.
- E.g., Librarians included respondents from Africa (4), Asia-Pacific (1), Europe (13), North America, non-US (1), Other - UK (2), US (30); Publishers included respondents from Africa (3), Asia-Pacific (2), Europe (19), Latin America (3), US (6), Other - UK (1).
- We will likely prioritize these standards in our next calls for submissions to Infra Finder (note: open infrastructures can fill out an expression of interest to join at any time; we consider applications on a rolling basis).
- As previously noted, because we are concerned about how the poll data could be used and interpreted out of context, we have intentionally masked the signalling that Gephi provides through features like node size and line darkness.
- Analysis of this set of responses according to role and region/geolocation revealed that these individuals self identified across a representative range of categories, including Europe, Africa, US, and Libraries, Publishing, Research, Teaching, Data Science and metadata, and Funding.
- Note that Infra Finder is an “opt in” service to which any open infrastructure can submit an application for review; those open infrastructures that are not included have not been omitted intentionally, they just have not yet approached us. Information on Infra Finder eligibility can be found in the FAQ: https://hackmd.io/4Lugk_tWSMyJBT1TXCmBxA#How-do-you-define-open-infrastructure